|
Profiting in the expected stock market storm
Stocks could take a big hit this summer but that may set the stage for a powerful rally. What should your next move be?
NEW YORK (CNNMoney.com) - If history is any guide, the stock market's in for a rough ride the next six months -- but then a powerful rally could very well follow. So what's an investor to do? Bail out now? Stay put and wait for the tough times to pass?
Keeping in mind that every investor's portfolio is different, and that generalizing can be hazardous, stepping back a bit over the next few months probably couldn't hurt, said Harry Clark, founder and CEO of Clark Capital Management Group. "People may want to lighten up on some stocks that have reached their targets and raise a little more cash, maybe put 20 percent in cash," Clark said. "Then when the market bottoms in the late summer or early fall, they have money to put back to work." Clark said he is expecting the Dow to pull back around 12 percent, with declines perhaps starting after the Federal Reserve finally does pause in its interest-rate hiking campaign, which most people on Wall Street expect to happen later this year. Barry Ritholtz, chief investment officer at Ritholtz Capital Partners, said the market drop could be even steeper. But as with all historical indicators, the trend doesn't always hold true. Here's a look at why the trend may very well prove consistent this year, with a big fall followed by a good buying opportunity near the end of the year. Bracing for a fall?
Sure, stocks look fine now, but things could get uglier as the year wears on. The Dow and the S&P 500 are nearing five-year highs, the economy is strengthening after a rough fourth quarter and interest rates, though set to keep rising at least a little while longer, remain historically low. All of that is fairly supportive for stocks. But it's not as supportive as the extremely upbeat environment three years ago that sparked the current bull market, Ritholtz said. At that time, in late 2002, "corporate profits were improving, interest rates were declining and oil wasn't the issue it is now," Ritholtz said, noting overall the market looks a lot more risky now. There's also the issue of the bull getting old and the market perhaps being due for a sell-off. "In this cyclical bull market that's been in place since October 2002, we haven't had a big pullback," said Sam Stovall, chief investment strategist at Standard & Poor's, noting that the S&P 500 has not seen a decline of more than 10 percent. "You need to digest some of those gains in order to move higher," Stovall added. There are also all the seasonal factors to suggest a decline is coming. As the old Wall Street adage, "sell in May and go away," makes clear, the six months between May and October are typically tough for stocks. Market historians who think the market follows the four-year cycle of the presidency say year two is typically the weakest. 2006 is year two of President Bush's second term. Put these two factors together, and you get something of a potential 'worst of the worst' scenario over the next six months, as a recent study from Standard & Poor's made clear. (Full story). Essentially, the study noted that seasonally, the second and third quarters of 2006 -- and any second year in the presidential cycle -- tend to be worse than any other quarters in the four-year period. Fall tomorrow, get flush the day after?
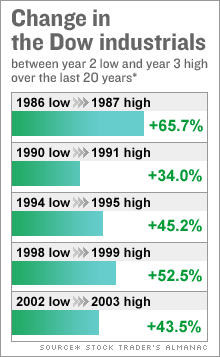
Since 1913, the Dow industrials have seen an average decline of 22.2 percent between the high it hit in the first year of the four-year cycle -- in this case 2005 -- and the low hit in the second year, namely 2006, according to the Stock Trader's Almanac. Right now the Dow is hovering about 3 percent above last year's high, hit in March of 2005, suggesting a big drop may be coming. But after it bottoms out, the Dow tends to rally substantially through the third year of the presidency -- in this case 2007. On average, since 1914, the Dow has jumped a whopping 50 percent from the bottom it hits in the second year to the top in the third year, the Almanac says. This bounce ties in with statistics that show the second and third years of the four-year cycle tend to be the best for stock markets as the party in power gears up for the following year's election, and tries to keep investors happy.
Barring unpredictable developments in Iraq or global oil supply, the analysts said, the market could see a similar move, down and then back up, later in 2006 and 2007. |
|


