|
The end of oil's stunning ride Prices may steady at $55 to $65 but that doesn't mean an end to wild swings in the energy sector. NEW YORK (CNNMoney.com) -- The energy crisis is over. You just might not be that happy with the ending. The last four years has seen a nearly unprecedented surge in oil, gasoline and natural gas prices.
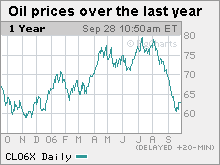
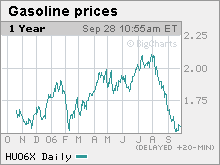
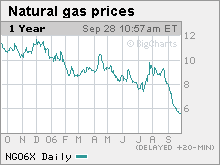
A global economic boom - fueled by Brazil, China, India, Mexico and the United States, among other countries, has sparked a ravenous new appetite for fuel that left producers scrambling to meet demand. And this summer a combination of events hit the oil market, including a messy switch in gasoline blends, fears of another tough hurricane season, unabated gasoline demand and war in the Middle East. And oh yeah, a truckload of speculators pouring "hot money" into the market. They combined in what some analysts called a "perfect storm" to push crude oil to a record trading high of $78.40, nearly four times higher than where it began 2002, unadjusted for inflation. Many of those events have now passed, supplies are at near-record levels and the forecast is for a warm winter. In response, oil, gasoline and natural gas have tumbled in recent weeks. Crude now trades above $60 a barrel, lower than where it began the year but still three times higher than the start of 2002. The bad news (or good, depending on your point of view) is it looks as though today's prices are here to stay, possibly through much of next year. Why they won't go much lower Most analysts utter one word when asked why the selloff won't continue: OPEC. The cartel still controls over 30 percent of world production. And while it's currently pumping at near full capacity and has little ability to bring prices down, it can easily boost prices by narrowing the taps. Even talk of a production cut can have a strong effect. Crude prices were racing towards $60 a barrel earlier week but were suddenly halted partly by murmurs from OPEC members, who used words like "good" and "reasonable" to describe $60 oil, sparking investor fears of a production cut. "OPEC starts to get pretty itchy when we go below that," said Neal Dingmann, a senior energy analyst at Pritchard Capital Partners in Houston who has a target price of $57.50 to $65 for crude over the next several months. "If we fall under, you start to hear some chatter." Although how low OPEC is willing to let oil slide is a matter of some debate. "I think prices have to go into the mid-$50s before the Saudis (really) start jawboning the market," said Nauman Barakat, an energy trader at Macquarie Futures, the trading arm of Macquarie investment bank. Experts also cite tight supplies for many raw materials in general as growth picks up in countries like China, Brazil and India - and the trend of investors diversifying into the sector as another reason why prices are unlikely to fall too far. "People show interest in commodities as an asset class," said Katherine Spector, an energy strategist at J.P. Morgan, which has a 2007 average crude price of $64 a barrel. "We don't see that diminishing." With many large oil fields declining in output, and talk swirling by a small yet vocal minority of people who think the world has reached it's peak oil production, and etimates from the Energy Information Administration that the world will use 50 percent more oil by 2030 - it's hard to see why investor interest would diminish. But don't expect $100 a barrel But that doesn't mean prices are going to spike again soon. The biggest reason not is that stockpiles are near record levels and fall is what experts call the "shoulder months" - the time between strong summer demand from driving and air conditioning and winter's heating needs. Basically, there's not much to move the market. Come 2007, investments that have been made in production, thanks to the recent high prices, could start to come online and boost supply. In the following years Canada's massive tar sands project and other new discoveries like Chevron's Jack field deep in the Gulf of Mexico should begin to yield oil, although prices need to remain above $50 for these ventures to be profitable. Couple this with a possible economic slowdown, especially in the U.S., and it's hard to see another run towards $80 like we saw over the summer. "It's pretty evident that supply is responding," said Pritchard Capital's Dingmann, adding prices will "stay pretty much range-bound." So energy's lost its luster? Hardly. Geopolitics and Mother Nature are always uncertainties. All the analysts interviewed stressed that their price forecasts don't account for an "unforeseen event" such as a confrontation with Iran or a late-season hurricane. And higher oil prices mean there's more money to be made, and not just through stock in ExxonMobil (Charts), BP (Charts) or Chevron (Charts). "You could make yourself a nice little living buying crude at $55 and selling it at $65," said Stephen Schork, president of the Schork Report, an industry newsletter. But perhaps the most exciting thing about oil in the $55 to $65 range is that it opens up a whole slew of investment alternatives - from tar sands to wind power to fuel cell cars - that weren't feasible when fossil fuels were cheap. Or as Schork put it when asked if the crisis was over: "I wouldn't say we're out of the woods. I'd say we've woken up." __________________ |
|


