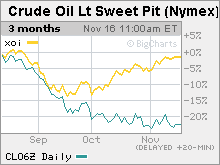
Slide ends for energy stocksShare prices turn higher despite oil's continued downward trend. What's driving the turnaround?NEW YORK (CNNMoney.com) -- A month or so ago it seemed as though a stock play in energy made at the beginning of the year could end up being a bad bet. As crude prices tumbled, stocks in the oil and gas sector followed suit. By mid- September, the Amex Oil Index, which had chalked up an impressive 20 percent return year-to-date so far, looked likely to hit negative territory, sliding by 15 percent in less than a month.
Similar patterns were seen in the share price of the big three U.S. oil majors Chevron (Charts), ConocoPhillips (Charts) and ExxonMobil (Charts). But then a curious thing happened. Although oil prices continued to fall, energy stocks, which normally closely track the price of crude, turned around. Oil prices have dropped 15 percent since the beginning of September, yet the Amex oil index is up 5 percent. "It's counter-intuitive to have oil prices come down but oil stocks go up," said Brian Hicks, co-manager of the Global Resources Fund at U.S. Global Investors. So what saved oil stocks? The first thing is that oil prices, while still trending lower, have at least stemmed the precipitous slide seen in at the end of summer. Crude has been trading in a band between $56 and $62 for the last few weeks, supported by OPEC production cuts and the coming winter heating period. "Your dealing with a lot of market psychology, and the market is getting some confidence that the worst of the price drop is over," said Ken Carol, an oil analyst at Johnson Rice & Co. Also on the price front, many analysts expect crude prices to rise as soon as the first cold snap hits the U.S. or geopolitical tensions, relatively quiet for the last couple of months, inevitably flare up. Another thing pushing up oil stocks is the fact the many still see them as relative bargains. ExxonMobil's price-to-earnings ratio, an indicator of how expensive a stock is in relation to its earnings power, is still about 11, compared to the S&P average of about 15. That's despite the fact that Exxon shares hit an all-time high last month when the company posted the second-highest quarterly profit in corporate history. Chevron's P/E is even lower, at 9, while ConocoPhillps trades at a paltry 6. While the oil majors usually trade below the S&P average due to the cyclical nature of commodities and their limited potential for growth, analysts believe these multiples are particularly cheap. "They were not overly bid up when we had $70 oil," said Hicks, adding "The energy stocks probably fell too hard in the third quarter." Finally, there's the belief from many in the investment community that the fundamentals behind oil's recent rise - crude has tripled in price since the start of 2002 - remain solid. "The long-term ability of the world to add production is small, or if you believe in the peak oil theory, negative," said Carol. "Ultimately, people believe that we have not solved a tightening supply situation." ______________ |
|


