Most Profitable

Exxon Mobil leads Fortune's list of top earners this year. Which other companies are among the most profitable on the planet?

UAL
UAL
Global 500 rank: 366 (Previous rank: 369)
Profits (millions): $22,876
Change from 2005: NA
Get quote: UAUA

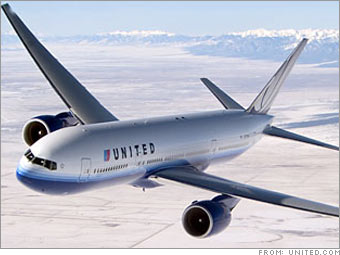
After emerging from bankruptcy in 2006, the holding company that owns United Airlines showed net income of $22.9 billion. But that was primarily a reflection of special Chapter 11 accounting. Operations income did improve from $447 million in 2005 to $666 million last year as the U.S. airline market finally bounced back from its post-9/11 troubles.

See more Global 500 data for UAL

Exxon Mobil

Shell

UAL

BP

Citigroup

B of A

GE

Gazprom

Pfizer

Chevron

HSBC

ConocoPhillips

Total

Chase

Toyota

AIG

CNP

Petronas

Petrobras

Microsoft
Full List Old-economy outfits top Fortune's annual Global 500 list, thanks to rising oil prices and a slew of mergers that drove record profits. (more)
The top 25 Wal-Mart retakes the lead as the world's biggest company. See which other outfits top our list. (more)
Money losers Which automaker lost a whopping $12.6 billion last year? And just how far into the red are stalwarts like Goodyear and Tyson Foods? (more)

Most stock quote data provided by BATS. Market indices are shown in real time, except for the DJIA, which is delayed by two minutes. All times are ET. Disclaimer. Morningstar: © 2018 Morningstar, Inc. All Rights Reserved. Factset: FactSet Research Systems Inc. 2018. All rights reserved. Chicago Mercantile Association: Certain market data is the property of Chicago Mercantile Exchange Inc. and its licensors. All rights reserved. Dow Jones: The Dow Jones branded indices are proprietary to and are calculated, distributed and marketed by DJI Opco, a subsidiary of S&P Dow Jones Indices LLC and have been licensed for use to S&P Opco, LLC and CNN. Standard & Poor's and S&P are registered trademarks of Standard & Poor's Financial Services LLC and Dow Jones is a registered trademark of Dow Jones Trademark Holdings LLC. All content of the Dow Jones branded indices © S&P Dow Jones Indices LLC 2018 and/or its affiliates.

Most stock quote data provided by BATS. Market indices are shown in real time, except for the DJIA, which is delayed by two minutes. All times are ET. Disclaimer. Morningstar: © 2018 Morningstar, Inc. All Rights Reserved. Factset: FactSet Research Systems Inc. 2018. All rights reserved. Chicago Mercantile Association: Certain market data is the property of Chicago Mercantile Exchange Inc. and its licensors. All rights reserved. Dow Jones: The Dow Jones branded indices are proprietary to and are calculated, distributed and marketed by DJI Opco, a subsidiary of S&P Dow Jones Indices LLC and have been licensed for use to S&P Opco, LLC and CNN. Standard & Poor's and S&P are registered trademarks of Standard & Poor's Financial Services LLC and Dow Jones is a registered trademark of Dow Jones Trademark Holdings LLC. All content of the Dow Jones branded indices © S&P Dow Jones Indices LLC 2018 and/or its affiliates.