Homes from the fastest- and slowest-growing markets

Here are 12 median-priced homes in markets around the nation. Some of these markets are still gaining ground but in others, prices are headed down.

Las Vegas, Nevada
12-month forecast: 8.9% loss
Las Vegas, Nevada
Median price: $325,000
This home's price: $314,000
Bedrooms: 3
Baths: 2
Square footage: 1,494

Details: Unlike the usual cookie-cutter tract house, this house has a more traditional, settled look to it. It's in a gated community south of the Strip that has easy commuting access to casinos, downtown and the airport, one reason why it may retain its value better than most Vegas-area homes.

"There is a little bit of inventory in the neighborhood," says listing agent Rob Jenson, "and prices will probably go down."

But great amenities - spa, pool, golf - and some builder upgrades should help prop up the value of this one-time model home for the development.

Brokerage: Re/Max - The Jenson Group
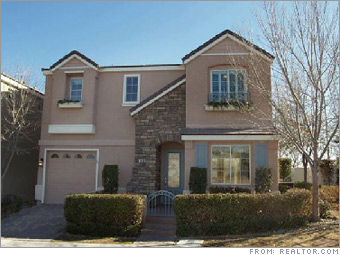
Tulsa, Oklahoma

Syracuse

Scranton

Birmingham

Wichita

Edinburg, Texas

Massapequa

Orlando

North Miami

Oro Valley, Arizona

Las Vegas, Nevada

Los Angeles
It's gut-check time in Miami and Las Vegas. Plus: See the few bright spots, the most expensive areas – and the most vulnerable. (more)
Home shoppers finally have the upper hand. Here's how to maximize that advantage. (more)
2 families were struggling to sell their homes. Money Magazine came up with 11 simple moves to help. (more)

Most stock quote data provided by BATS. Market indices are shown in real time, except for the DJIA, which is delayed by two minutes. All times are ET. Disclaimer. Morningstar: © 2018 Morningstar, Inc. All Rights Reserved. Factset: FactSet Research Systems Inc. 2018. All rights reserved. Chicago Mercantile Association: Certain market data is the property of Chicago Mercantile Exchange Inc. and its licensors. All rights reserved. Dow Jones: The Dow Jones branded indices are proprietary to and are calculated, distributed and marketed by DJI Opco, a subsidiary of S&P Dow Jones Indices LLC and have been licensed for use to S&P Opco, LLC and CNN. Standard & Poor's and S&P are registered trademarks of Standard & Poor's Financial Services LLC and Dow Jones is a registered trademark of Dow Jones Trademark Holdings LLC. All content of the Dow Jones branded indices © S&P Dow Jones Indices LLC 2018 and/or its affiliates.

Most stock quote data provided by BATS. Market indices are shown in real time, except for the DJIA, which is delayed by two minutes. All times are ET. Disclaimer. Morningstar: © 2018 Morningstar, Inc. All Rights Reserved. Factset: FactSet Research Systems Inc. 2018. All rights reserved. Chicago Mercantile Association: Certain market data is the property of Chicago Mercantile Exchange Inc. and its licensors. All rights reserved. Dow Jones: The Dow Jones branded indices are proprietary to and are calculated, distributed and marketed by DJI Opco, a subsidiary of S&P Dow Jones Indices LLC and have been licensed for use to S&P Opco, LLC and CNN. Standard & Poor's and S&P are registered trademarks of Standard & Poor's Financial Services LLC and Dow Jones is a registered trademark of Dow Jones Trademark Holdings LLC. All content of the Dow Jones branded indices © S&P Dow Jones Indices LLC 2018 and/or its affiliates.