Median home price: $483,000
This home's price: $490,000
Bedrooms: 4
Baths: 2
Square footage: N/A
Details: Future Long Island property values will be hurt by affordability issues and oversized out-migration over the next few years. Taxes are high here and many older Islanders are retiring to lower-cost areas.
A steady economy, however, should keep prices from dropping too much. The island also benefits from its proximity to New York City, where extremely high, and growing, home prices will surely drive middle class families out to more affordable areas.
Massapequa prices never got as stratospheric as some of the more expensive Long Island neighborhoods and its solid middle-class character should enable prices to hold up better than some of the more volatile towns on Long Island.
Broker: Century 21
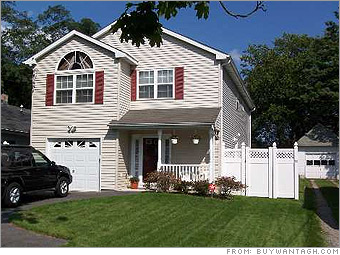
Massapequa, New York
| It's gut-check time in Miami and Las Vegas. Plus: See the few bright spots, the most expensive areas – and the most vulnerable. (more) Home shoppers finally have the upper hand. Here's how to maximize that advantage. (more) 2 families were struggling to sell their homes. Money Magazine came up with 11 simple moves to help. (more) |