OfficeMax
Ticker: OMX
YTD stock performance: -72%
Market cap: $432 million
Fortune 500 rank: 330

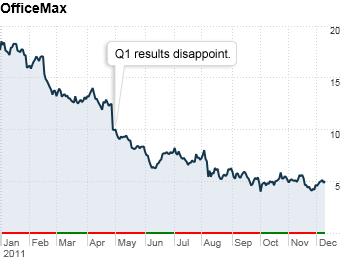
These are lean times for OfficeMax. Between 2006 and 2010, sales fell more than $1 billion. Then in 2011, the company disappointed analysts who'd already braced themselves for further drops. In April, Goldman Sachs noted margins fell "well short," and projected a negative outlook based on third-quarter results this fall.

The company still hopes to turn things around, but operating in a competitive sector in a bad economy does not help. OfficeMax told analysts this summer that its hoped-for return to peak operating margins has to be slowed down. Under a new roadmap presented to investors this November, the retailer said it has to take longer to strengthen its foundation and reverse declines at least into 2013.


By CNNMoney's Ben Rooney and Fortune's Alex Konrad @FortuneMagazine - Last updated December 21 2011: 8:14 AM ET
Join the Conversation
Fortune 500: Top-performing stocks of 2011

It's been a hot and cold year for the stock market, but these Fortune 500 companies managed to float to the top with impressive gains. From Ross Stores to MasterCard, here are the biggest winners.

Most Popular


Most stock quote data provided by BATS. Market indices are shown in real time, except for the DJIA, which is delayed by two minutes. All times are ET. Disclaimer. Morningstar: © 2018 Morningstar, Inc. All Rights Reserved. Factset: FactSet Research Systems Inc. 2018. All rights reserved. Chicago Mercantile Association: Certain market data is the property of Chicago Mercantile Exchange Inc. and its licensors. All rights reserved. Dow Jones: The Dow Jones branded indices are proprietary to and are calculated, distributed and marketed by DJI Opco, a subsidiary of S&P Dow Jones Indices LLC and have been licensed for use to S&P Opco, LLC and CNN. Standard & Poor's and S&P are registered trademarks of Standard & Poor's Financial Services LLC and Dow Jones is a registered trademark of Dow Jones Trademark Holdings LLC. All content of the Dow Jones branded indices © S&P Dow Jones Indices LLC 2018 and/or its affiliates.