Video
-


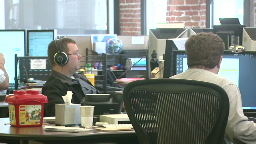 CEO Mark Benioff says the online services firm must keep spending nearly 50% of revenues on sales and marketing to grow. Watch
 -
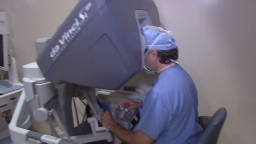 Intuitive Surgical, makers of the da Vinci robotic surgery system, has been growing at a fast clip the past several years. Watch
 -
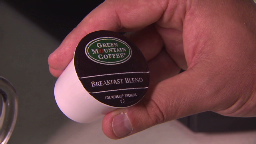 The Vermont coffee maker, #2 on the Fastest-Growing Companies list, tries to make its single-use coffee pod environmentally friendly. Watch


| Company | Revenue growth (3-year annual rate) |
|---|---|
| International Assets Holding | 228% |
| SXC Health Solutions | 218% |
| First Solar | 141% |
| Company | EPS growth (3-year annual rate) |
|---|---|
| First Solar | 228% |
| Sapient | 188% |
| International Assets Holding | 185% |
| Company | Total return (3-year annual rate) |
|---|---|
| Netflix | 78% |
| Green Mountain Coffee Roasters | 64% |
| Ebix | 52% |
To qualify, a company -- domestic or foreign -- must be trading on a major U.S. stock exchange; file quarterly reports to the SEC; have a minimum market...
More
