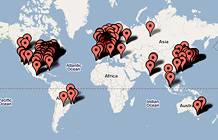
Find your top companies
 High revenue growth  High profit growth
 Based in Asia  Based in Europe
 Based in U.S.  Top 5 in its industry
 Big employer  Small employer
SUBMIT


U.S. 153
Japan 64
France 39
U.S. Postal Service 785,929
Sinopec 634,011
Hon Hai Precision Industry 550,000
Exxon Mobil $40,610
Royal Dutch Shell $31,331
General Electric $22,208
FAQ and methodology
All companies on the list must publish financial data and report part or all of their figures to a government agency. In the U.S., private companies and cooperatives... More
Current Issue
  • Give the gift of Fortune
  • Get the Fortune app
  • Subscribe
  • All
    companies
  • All
    industries
Top industries: Most profitable
1 Mining, Crude-oil production 19.8
2 Pharmaceuticals 17.7
3 Beverages 11.9
4 Household and Personal Products 11.8
5 Network and Other Communications Equipment 11.6
6 Building Materials, Glass 10.8
7 Entertainment 10.7
8 Banks: Commercial and Savings 10.4
9 Food Consumer Products 9.9
10 Utilities 9.0
11 Insurance: Property and Casualty (stock) 8.7
12 Telecommunications 8.4
13 Shipping 8.0
14 Industrial and Farm Equipment 7.9
15 Metals 7.4
16 Energy 7.2
17 Chemicals 7.0
18 Aerospace and Defense 6.7
19 Petroleum Refining 6.5
20 Health Care: Insurance and Managed Care 6.2
21 Securities 5.4
22 Computers, Office Equipment 4.8
23 Insurance: Life, Health (stock) 4.7
24 General Merchandisers 3.9
25 Specialty Retailers 3.8
26 Motor Vehicles and Parts 3.8
27 Trading 3.6
28 Electronics, Electrical Equipment 3.6
29 Airlines 3.1
30 Engineering, Construction 3.1
31 Food and Drug Stores 2.2
32 Mail, Package and Freight Delivery 2.1
33 Wholesalers: Health Care 1.2
34 Food Services 0.0
34 Food Production 0.0
34 Semiconductors and Other Electronic Components 0.0
34 Railroads 0.0
34 Pipelines 0.0
34 Miscellaneous 0.0
34 Insurance: Property and Casualty (mutual) 0.0
34 Insurance: Life, Health (mutual) 0.0
34 Information Technology Services 0.0
34 Computer Software 0.0
34 Wholesalers: Food and Grocery 0.0
34 Wholesalers: Electronics and Office Equipment 0.0
34 Health Care: Pharmacy and Other Services 0.0
34 Tobacco 0.0
34 Automotive Retailing, Services 0.0
34 Temporary Help 0.0
34 Forest and Paper Products 0.0
34 Diversified Financials -3.0
From the July 21, 2008 issue
Top 50
Headquarters
MAPS
What Readers Say
They speak out on Wal-Mart and other 500 companies...


Most stock quote data provided by BATS. Market indices are shown in real time, except for the DJIA, which is delayed by two minutes. All times are ET. Disclaimer. Morningstar: © 2018 Morningstar, Inc. All Rights Reserved. Factset: FactSet Research Systems Inc. 2018. All rights reserved. Chicago Mercantile Association: Certain market data is the property of Chicago Mercantile Exchange Inc. and its licensors. All rights reserved. Dow Jones: The Dow Jones branded indices are proprietary to and are calculated, distributed and marketed by DJI Opco, a subsidiary of S&P Dow Jones Indices LLC and have been licensed for use to S&P Opco, LLC and CNN. Standard & Poor's and S&P are registered trademarks of Standard & Poor's Financial Services LLC and Dow Jones is a registered trademark of Dow Jones Trademark Holdings LLC. All content of the Dow Jones branded indices © S&P Dow Jones Indices LLC 2018 and/or its affiliates.