FORTUNE -- Don't believe the bulls who predict a new era of rising stock prices. Sure, their arguments sound convincing: Confidence will surge following the arrival of a new, business-friendly Congress, the U.S. economy always rebounds strongly after a deep recession -- it's just taking longer this time. Or, it's the nature of the market to post big gains after a decade or more of poor returns.
Unfortunately, the basic math doesn't support the optimists' case. Put simply, the stock market is in a box that makes high future returns virtually impossible for people who invest in the S&P 500 or another index replicating the overall market. The reason is that corporate earnings are far outpacing the slow, grinding recovery. In fact, they're practically at a cyclical peak -- and possibly in a mini-bubble. At the same time, investors are paying an extremely big price for those already robust profits.
Today's premium multiples wouldn't be a problem if profits could grow at a rapid pace -- in theory at least, high price-to-earnings ratios are a signal that they're destined to do just that.
It won't happen this time, for a simple reason: When earnings are already at lofty levels, they typically stagnate or fall rather than grow. Hence, one route to rising equity prices is effectively blocked by the rise in profits that's already occurred, and the other is closed by high prices. Even if the economy improves dramatically, prices are far more likely to fall than rise. The rich rewards will go the patient contrarians who buy not at these prices, but after a major correction.
Earnings explosion
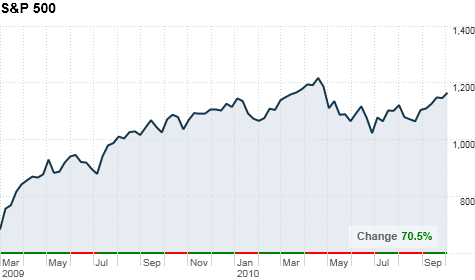
Let's examine the most surprising feature of the tepid recovery, the remarkable resurgence in profits. For 2010, S&P reported earnings are on track to reach $71 per share. That's the second best number in history. It's 39% higher than in 2009, a strong comeback year after the wipeout in 2008, and just 15% below the record of $81.51 posted in 2006. Corporate profits are currently a strong 11.1% of GDP, versus their long-term average of 9.2%.
Why the earnings explosion? Starting in late 2008, U.S. companies chopped costs, especially labor, as if preparing not for a recession, but a depression. The cataclysm didn't come. Nevertheless, corporations are still operating with ultra-lean workforces, leading to a big jump in productivity. They're also benefiting from the steep fall in interest payments on their debt. The result: An amazing surge in profits.
What must happen for investors to garner strong returns when earnings are already commanding them, as they are now? History shows that profits can't grow from heights like these, at least not for long. As a result, investors must buy in at lower-than-average PE multiples that have room to expand when earnings rebound a few years hence, and also collect relatively high dividend yields, another reward from low equity prices.
None of those conditions exist today. Right now, the PE multiple for the S&P 500 seems reasonable at around 14.5. But remember, that number is calculated on near-record earnings that are likely to fall or at least move sideways with inflation for years to come.
The best measure of whether stocks are cheap or expensive -- and what that means for their future performance -- is Yale economist Robert Shiller's Cyclically Adjusted Price/Earnings ratio, or CAPE. Shiller smoothes the extreme peaks and valleys in earnings by taking a ten-year average of inflation-adjusted profits, and essentially saying that number, not today's volatile figure, is the best snapshot of what companies earn on a durable, long-term basis. Today, the Shiller PE stands at around 21.
That's a big number -- the average PE since 1888 is around 16, and stood at 14.6 before the 20 years of abnormally high valuations starting in the early 1990s, a frothy period that included the tech bubble. It's also a general rule that the higher the CAPE when investors buy shares, the lower the future returns. Cliff Asness, chief of hedge fund AQR Capital, calculates that entering the market at a multiple of between 11.9 and 14.6 brought a 10% median annual gain a decade later. (The Asness analysis covers the Shiller data from 1927 to 2004.) By contrast, those who buy the S&P 500 at a multiple of around 20 get something between the mid-single digits, and a slightly negative return.
Betting on a 30% drop
Today's investors face that daunting fate. Dividends won't help much: the current yield is just 1.9%, versus an historic average of 4.75%.
High multiples, like the PE we're seeing now, explain why equity performance has been underwhelming for almost two decades. The late 2008 period marked the first time since 1992 that the Shiller PE fell below 20. Investors who bought into the S&P at around today's PE in early 1992 made paltry returns of between 5% and 6%, including dividends. And that's after the huge, 45% rebound in the past 18 months.
It's indeed possible that stocks are correctly priced, and the Shiller PE stays where it is now. In that case, investors will get mid-single-digit returns. The most likely outcome: They won't be satisfied with those gains, and hence will force the market to provide much better returns by the only route possible -- by severely pushing down prices.
The best bet is that the S&P drops around 30%, to the 800-range it hit in March of 2009. Then, the PE slipped below 14, and yields were almost 4%. For the first time in almost two decades, stocks became a bargain, and that's what it will take to make them a bargain again.
Sure, the economy can, and probably will rebound. But that provides no escape from this quandary. We could easily get better growth AND lower stock prices. Indeed, lower prices are the only way out of this box. ![]()


| Overnight Avg Rate | Latest | Change | Last Week |
|---|---|---|---|
| 30 yr fixed | 3.80% | 3.88% | |
| 15 yr fixed | 3.20% | 3.23% | |
| 5/1 ARM | 3.84% | 3.88% | |
| 30 yr refi | 3.82% | 3.93% | |
| 15 yr refi | 3.20% | 3.23% |
Today's featured rates:


| Company | Price | Change | % Change |
|---|---|---|---|
| Ford Motor Co | 8.29 | 0.05 | 0.61% |
| Advanced Micro Devic... | 54.59 | 0.70 | 1.30% |
| Cisco Systems Inc | 47.49 | -2.44 | -4.89% |
| General Electric Co | 13.00 | -0.16 | -1.22% |
| Kraft Heinz Co | 27.84 | -2.20 | -7.32% |
| Index | Last | Change | % Change |
|---|---|---|---|
| Dow | 32,627.97 | -234.33 | -0.71% |
| Nasdaq | 13,215.24 | 99.07 | 0.76% |
| S&P 500 | 3,913.10 | -2.36 | -0.06% |
| Treasuries | 1.73 | 0.00 | 0.12% |
|
Bankrupt toy retailer tells bankruptcy court it is looking at possibly reviving the Toys 'R' Us and Babies 'R' Us brands. More |
Land O'Lakes CEO Beth Ford charts her career path, from her first job to becoming the first openly gay CEO at a Fortune 500 company in an interview with CNN's Boss Files. More |
Honda and General Motors are creating a new generation of fully autonomous vehicles. More |
In 1998, Ntsiki Biyela won a scholarship to study wine making. Now she's about to launch her own brand. More |
Whether you hedge inflation or look for a return that outpaces inflation, here's how to prepare. More |

