(MONEY Magazine) -- It's hard to find fault with index funds: Low costs and broad diversification make them the surest bet for the long run. But by definition index funds are no better than average, and let's face it: Sometimes you want to win a race.
The challenge is finding a fund manager with a real shot at outperformance. Below-average expenses and long-term success are good guideposts. But another trait helps: The guts to run in a different direction.

That's the conclusion drawn by Antti Petajisto of NYU Stern School of Business, who has studied which investing styles produce index-topping performance.
Many actively managed funds have portfolios that aren't that different from the indexes they track (a practice known as "closet indexing"). Yet they charge up to five times more than actual index funds.
Another group of managers are independent stock pickers. "Go only with a very active fund or a low-cost index fund," says Petajisto. "Conservative closet-index funds do not justify their expenses."
Along with K.J. Martijn Cremers of Yale School of Management, Petajisto has developed a grading system called "active share," which measures the portion of a portfolio that differs from its benchmark. Index funds are at or near zero; idiosyncratic stock pickers land in the 90s.
Looking at returns for 1990 to 2009, Petajisto found that only highly active stock pickers (those with active shares averaging 97%) outperformed their benchmarks --by an annualized 1.26 percentage points on average after expenses.
Closet indexers, those with an average active share below 60%, lagged by nearly a percentage point. An analysis by Morningstar reaches a similar conclusion: Since 2006 the most actively managed large-cap stock funds consistently have beaten the least active.
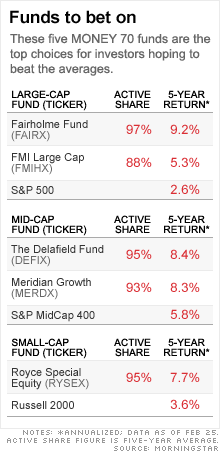
A poster child for this extreme approach is Fairholme Fund (FAIRX), which has averaged an active share of 97% over the past five years. Run by iconoclastic investor Bruce Berkowitz, who makes big bets on bargain stocks of all sizes, the MONEY 70 fund has returned an annualized 11.6% over the past decade. On the other hand, Columbia Large Cap Core (NSEPX), with a 1.8% return for that period and an active share of 56%, typifies a closet indexer.
Of course, a fund that differs dramatically from its benchmark may fall behind it too. "If you were doing this exercise 10 years ago," warns John Rekenthaler, Morningstar's vice president of research, "you would almost certainly pick Legg Mason Value," a fund that once beat the market 15 years running only to get walloped in the financial crisis.
Plus, the system isn't foolproof. Most of American Funds' domestic stock funds have beaten their indexes over five, 10, and 15 years, yet they tend to have low active shares.
With active share data not readily available, investors who want to take a flier on this type of manager face the task of identifying one. High turnover isn't a good predictor -- some of these managers rarely trade. You can compare a fund's top 10 holdings with its benchmark's (look for little overlap).
Morningstar fund analyst Ryan Leggio suggests checking what's called R-squared, a measurement of how closely a fund's return matches its benchmark (you can look it up at morningstar.com). Over the past five years Fairholme was only 78% correlated to the S&P 500. Remember: Not tracking an index can mean trailing it as well as beating it.
For five promising active managers, see the table at left. Their strategies can't be neatly summed up. Midcap Meridian Growth (MERDX) keeps to high-quality leaders; The Delafield Fund (DEFIX) bets on turnaround plays. Yet all share seasoned managers and below-average expenses. While you can't count on every stock pick paying off, low costs and experience have lasting value. ![]()


| Overnight Avg Rate | Latest | Change | Last Week |
|---|---|---|---|
| 30 yr fixed | 3.80% | 3.88% | |
| 15 yr fixed | 3.20% | 3.23% | |
| 5/1 ARM | 3.84% | 3.88% | |
| 30 yr refi | 3.82% | 3.93% | |
| 15 yr refi | 3.20% | 3.23% |
Today's featured rates:


| Index | Last | Change | % Change |
|---|---|---|---|
| Dow | 32,627.97 | -234.33 | -0.71% |
| Nasdaq | 13,215.24 | 99.07 | 0.76% |
| S&P 500 | 3,913.10 | -2.36 | -0.06% |
| Treasuries | 1.73 | 0.00 | 0.12% |
| Company | Price | Change | % Change |
|---|---|---|---|
| Ford Motor Co | 8.29 | 0.05 | 0.61% |
| Advanced Micro Devic... | 54.59 | 0.70 | 1.30% |
| Cisco Systems Inc | 47.49 | -2.44 | -4.89% |
| General Electric Co | 13.00 | -0.16 | -1.22% |
| Kraft Heinz Co | 27.84 | -2.20 | -7.32% |
|
Bankrupt toy retailer tells bankruptcy court it is looking at possibly reviving the Toys 'R' Us and Babies 'R' Us brands. More |
Land O'Lakes CEO Beth Ford charts her career path, from her first job to becoming the first openly gay CEO at a Fortune 500 company in an interview with CNN's Boss Files. More |
Honda and General Motors are creating a new generation of fully autonomous vehicles. More |
In 1998, Ntsiki Biyela won a scholarship to study wine making. Now she's about to launch her own brand. More |
Whether you hedge inflation or look for a return that outpaces inflation, here's how to prepare. More |