CNNMoney.com
Companies Economy International Corrections Pre-market Trading After-hours Trading Winners/Losers/Actives Bonds Currencies Commodities World Markets Money Magazine Real Estate Taxes Jobs Ask the Expert Money 101 Autos Mutual Funds The Help Desk Loan Center Best Places to Live Ask the Expert Ultimate Guide to Retirement Retirement Calculators Best Funds Best Places to Retire Fortune Brainstorm Tech Apple 2.0 Blog Big Tech Blog Sectors and Stocks Tech Talk Resource Guide Small Business Makeovers Questions & Answers Small Business Video 100 Best Places to Launch FSB 100 Fortune Small Business Fortune 500 Brainstorm Tech Investing Management C-Suite Rankings Main Create Portfolio Edit Portfolio Create Alerts Edit Alerts
6 of 7
BACKNEXT
Home Prices
Home Prices
At the end of the second quarter of 2008, home prices were down 4.8% from the same period a year before, according to the Office of Federal Housing Enterprise Oversight.

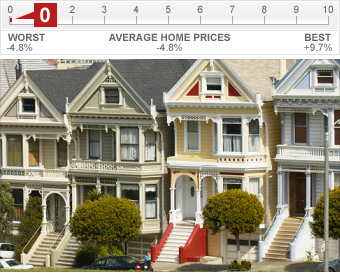
The current drop of 4.8% is actually the worst we have experienced in this generation. But just three years ago, during the housing boom of 2006, home appreciation grew at its fastest rate in the last 28 years. In the second and third quarters of 2005, just as prices started to take off, home prices were up 9.7% from the year before.

Pretty obviously, if a 4.8% decline in home prices is equal to 0 and 9.7% is equal to 10, we're now at the very bottom of the spectrum.

Home Prices: 0

NEXT: The numbers tell it

Last updated October 31 2008: 9:42 AM ET
More Galleries
Holiday gifts for the yoga nut These 7 small brands are helping fuel a booming yoga industry. More
Best of the L.A. Auto Show Fuel economy is the name of the game in Southern California. More
Are things really getting better? Last quarter, the economy grew by the largest amount since the summer of 2007, but there are signs that things are still getting worse. More

Special Offer
© 2009 Cable News Network. A Time Warner Company. All Rights Reserved. Terms under which this service is provided to you. Privacy Policy
Copyright © 2009 BigCharts.com Inc. All rights reserved. Please see our Terms of Use.
MarketWatch, the MarketWatch logo, and BigCharts are registered trademarks of MarketWatch, Inc.
Intraday data provided by Interactive Data Real-Time Services and subject to the Terms of Use.
Intraday data is at least 20-minutes delayed. All times are ET.
Historical, current end-of-day data, and splits data provided by Interactive Data Pricing and Reference Data.
Fundamental data provided by Morningstar, Inc..
SEC Filings data provided by Edgar Online Inc..
Earnings data provided by FactSet CallStreet, LLC.