CNNMoney.com
Companies Economy International Corrections Pre-market Trading After-hours Trading Winners/Losers/Actives Bonds Currencies Commodities World Markets Money Magazine Real Estate Taxes Jobs Ask the Expert Money 101 Autos Mutual Funds The Help Desk Loan Center Best Places to Live Ask the Expert Ultimate Guide to Retirement Retirement Calculators Best Funds Best Places to Retire Fortune Brainstorm Tech Apple 2.0 Blog Big Tech Blog Sectors and Stocks Tech Talk Resource Guide Small Business Makeovers Questions & Answers Small Business Video 100 Best Places to Launch FSB 100 Fortune Small Business Fortune 500 Brainstorm Tech Investing Management C-Suite Rankings Main Create Portfolio Edit Portfolio Create Alerts Edit Alerts

Stocks' wild ride: 8 days to remember

Stocks were on a roller coaster in 2008 as investors tried to keep up with bailouts, bankruptcies, a credit crisis and a long recession.

1 of 8
BACKNEXT
Sep. 29 - Dow's biggest point loss ever
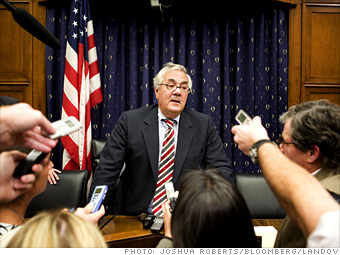
House Financial Services Committee chairman Barney Frank, D-Mass., talks to reporters after the House failed to pass the bailout bill on Sep. 29.
Dow closed at: 10,365.45
Change in points: -777.68
Percentage change: -6.98%

For the Dow Jones industrial average, 2008 is shaping up to be the worst year since 1931. On Jan. 2, the Dow opened at 13,261, but the index twice closed below 8,000 this year and now stands at around 8,500.

Sept. 29 was the single most damaging day of this abysmal year for the stock market. The Dow fell by nearly 800 points, its largest point drop in history, after the House of Representatives rejected the proposed $700 billion financial-sector bailout bill - a version of which it would eventually pass later that week.

The House voted down the proposal by a slim 228-205 margin after working for days to hash out an agreement.The defeat shocked the global markets. Financial institutions and investors were looking for a rescue from a credit crunch that exploded into a financial crisis after Lehman Brothers' collapse two weeks earlier.
NEXT: Oct. 15 - Biggest percentage decline since 1987
Last updated December 29 2008: 2:39 PM ET
More Galleries
Most (and least) affordable cities to buy a house Here are the 5 metro areas where the average American family can afford to purchase a median-priced home -- and the 5 where they can't. More
Heroes of the Economy: Where are they now? In March, CNNMoney profiled people making personal sacrifices to help others during the recession. Did their efforts pay off? CNNMoney checks in. More
11 big Black Friday deals An early peek at holiday ad circulars shows that post-Thanksgiving shoppers can score crazy deals -- like an LCD HDTV for half price, or a Nikon camera marked down 40%. More

Special Offer
© 2009 Cable News Network. A Time Warner Company. All Rights Reserved. Terms under which this service is provided to you. Privacy Policy
Copyright © 2009 BigCharts.com Inc. All rights reserved. Please see our Terms of Use.
MarketWatch, the MarketWatch logo, and BigCharts are registered trademarks of MarketWatch, Inc.
Intraday data provided by Interactive Data Real-Time Services and subject to the Terms of Use.
Intraday data is at least 20-minutes delayed. All times are ET.
Historical, current end-of-day data, and splits data provided by Interactive Data Pricing and Reference Data.
Fundamental data provided by Morningstar, Inc..
SEC Filings data provided by Edgar Online Inc..
Earnings data provided by FactSet CallStreet, LLC.