| Rank |
Company |
Revenues
($ millions) |
Profits
($ millions) |
| 201 |
TRW Automotive Holdings
|
11,614.0 |
55.0
|
| 202 |
Navistar International
|
11,569.0 |
320.0
|
| 203 |
Jacobs Engineering Group
|
11,467.4 |
399.9
|
| 204 |
Sun Microsystems
|
11,449.0 |
-2,234.0
|
| 205 |
World Fuel Services
|
11,295.2 |
117.1
|
| 206 |
Nucor
|
11,190.3 |
-293.6
|
| 207 |
Danaher
|
11,184.9 |
1,151.7
|
| 208 |
Dean Foods
|
11,158.4 |
240.3
|
| 209 |
Oneok
|
11,111.7 |
305.5
|
| 210 |
Liberty Global
|
11,110.4 |
-412.1
|
| 211 |
United States Steel
|
11,048.0 |
-1,401.0
|
| 212 |
AutoNation
|
11,015.6 |
198.0
|
| 213 |
Marriott International
|
10,908.0 |
-346.0
|
| 214 |
ITT
|
10,904.5 |
643.7
|
| 215 |
SAIC
|
10,847.0 |
497.0
|
| 216 |
Yum Brands
|
10,836.0 |
1,071.0
|
| 217 |
BB&T Corp.
|
10,818.0 |
853.0
|
| 218 |
Cummins
|
10,800.0 |
428.0
|
| 219 |
Entergy
|
10,745.7 |
1,231.1
|
| 220 |
Textron
|
10,548.0 |
-31.0
|
| 221 |
Marsh & McLennan
|
10,493.0 |
227.0
|
| 222 |
US Airways Group
|
10,458.0 |
-205.0
|
| 223 |
Texas Instruments
|
10,427.0 |
1,470.0
|
| 224 |
SunTrust Banks
|
10,420.0 |
-1,563.7
|
| 225 |
Qualcomm
|
10,416.0 |
1,592.0
|
| 226 |
Land O'Lakes
|
10,408.5 |
209.1
|
| 227 |
Liberty Media
|
10,398.0 |
6,462.0
|
| 228 |
Avon Products
|
10,382.8 |
625.8
|
| 229 |
Southwest Airlines
|
10,350.0 |
99.0
|
| 230 |
Parker Hannifin
|
10,309.0 |
508.5
|
| 231 |
Mosaic
|
10,298.0 |
2,350.2
|
| 232 |
BJ's Wholesale Club
|
10,187.0 |
132.1
|
| 233 |
H.J. Heinz
|
10,148.1 |
923.1
|
| 234 |
Thermo Fisher Scientific
|
10,109.7 |
850.3
|
| 235 |
Unum Group
|
10,091.0 |
852.6
|
| 236 |
Genuine Parts
|
10,057.5 |
399.6
|
| 237 |
Guardian Life Ins. Co. of America
|
10,040.9 |
82.9
|
| 238 |
Peter Kiewit Sons'
|
9,985.0 |
540.0
|
| 239 |
Progress Energy
|
9,885.0 |
757.0
|
| 240 |
R.R. Donnelley & Sons
|
9,857.4 |
-27.3
|
| 241 |
Starbucks
|
9,774.6 |
390.8
|
| 242 |
Lear
|
9,739.6 |
N.A.
|
| 243 |
Baker Hughes
|
9,664.0 |
421.0
|
| 244 |
Xcel Energy
|
9,644.3 |
680.9
|
| 245 |
Penske Automotive Group
|
9,558.1 |
76.5
|
| 246 |
Energy Future Holdings
|
9,546.0 |
344.0
|
| 247 |
Great Atlantic & Pacific Tea
|
9,516.2 |
-139.9
|
| 248 |
Fifth Third Bancorp
|
9,450.0 |
737.0
|
| 249 |
State Street Corp.
|
9,362.0 |
-1,881.0
|
| 250 |
First Data
|
9,313.8 |
-1,086.4
|
| 251 |
Pepco Holdings
|
9,259.0 |
235.0
|
| 252 |
URS
|
9,249.1 |
269.1
|
| 253 |
Tenet Healthcare
|
9,215.0 |
187.0
|
| 254 |
Regions Financial
|
9,087.1 |
-1,031.3
|
| 255 |
GameStop
|
9,078.0 |
377.3
|
| 256 |
Lincoln National
|
9,071.8 |
-484.7
|
| 257 |
Genworth Financial
|
9,069.0 |
-460.0
|
| 258 |
XTO Energy
|
9,064.0 |
2,019.0
|
| 259 |
CSX
|
9,041.0 |
1,152.0
|
| 260 |
Anadarko Petroleum
|
9,000.0 |
-135.0
|
| 261 |
Devon Energy
|
8,960.0 |
-2,479.0
|
| 262 |
Praxair
|
8,956.0 |
1,254.0
|
| 263 |
NRG Energy
|
8,952.0 |
942.0
|
| 264 |
Harrah's Entertainment
|
8,907.4 |
827.6
|
| 265 |
Automatic Data Processing
|
8,867.1 |
1,332.6
|
| 266 |
Principal Financial
|
8,849.1 |
622.7
|
| 267 |
eBay
|
8,727.4 |
2,389.1
|
| 268 |
Assurant
|
8,700.5 |
430.6
|
| 269 |
Limited Brands
|
8,632.5 |
447.9
|
| 270 |
Nordstrom
|
8,627.0 |
441.0
|
| 271 |
Apache
|
8,614.8 |
-284.4
|
| 272 |
Reynolds American
|
8,419.0 |
962.0
|
| 273 |
Air Products & Chemicals
|
8,381.4 |
631.3
|
| 274 |
Bank of New York Mellon Corp.
|
8,345.0 |
-1,084.0
|
| 275 |
CenterPoint Energy
|
8,281.0 |
372.0
|
| 276 |
Williams
|
8,255.0 |
285.0
|
| 277 |
Smith International
|
8,218.6 |
148.5
|
| 278 |
Republic Services
|
8,199.1 |
495.0
|
| 279 |
Boston Scientific
|
8,188.0 |
-1,025.0
|
| 280 |
Ashland
|
8,106.0 |
71.0
|
| 280 |
Sempra Energy
|
8,106.0 |
1,119.0
|
| 282 |
Paccar
|
8,086.5 |
111.9
|
| 283 |
Owens & Minor
|
8,037.6 |
104.7
|
| 284 |
Whole Foods Market
|
8,031.6 |
146.8
|
| 285 |
DTE Energy
|
8,014.0 |
532.0
|
| 286 |
Discover Financial Services
|
7,985.7 |
1,276.2
|
| 287 |
Norfolk Southern
|
7,969.0 |
1,034.0
|
| 288 |
Ameriprise Financial
|
7,946.0 |
722.0
|
| 289 |
Crown Holdings
|
7,938.0 |
334.0
|
| 290 |
Icahn Enterprises
|
7,865.0 |
234.0
|
| 291 |
Masco
|
7,858.0 |
-183.0
|
| 292 |
Cablevision Systems
|
7,773.3 |
285.6
|
| 293 |
Huntsman
|
7,763.0 |
114.0
|
| 294 |
Synnex
|
7,756.3 |
92.1
|
| 295 |
Newmont Mining
|
7,737.0 |
1,297.0
|
| 296 |
Chesapeake Energy
|
7,701.9 |
-5,830.0
|
| 297 |
Eastman Kodak
|
7,606.0 |
-210.0
|
| 298 |
Aon
|
7,595.0 |
747.0
|
| 299 |
Campbell Soup
|
7,586.0 |
736.0
|
| 300 |
PPL
|
7,585.0 |
407.0
|
|
Interactives
-
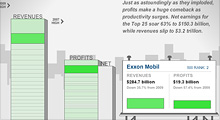
See how revenues and profits at America's 25 largest companies have risen and fallen over the past decade.
-
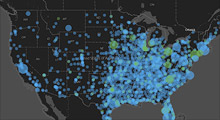
From a single store in 1962 to more than 4,300 outlets today, see how the biggest retailer has expanded.
|


