| Key financials |
$ millions |
% change
from 2008 |
| Revenues |
36,117.0 |
-8.7 |
| Profits |
6,134.0 |
-23.8 |
| Assets |
68,128.0 |
— |
| Stockholders' equity |
38,647.0 |
— |
| Market value (3/26/2010) |
151,500.3 |
— |
| Profits as % of |
|
| Revenues |
17.0 |
| Assets |
9.0 |
| Stockholders' equity |
15.9 |
| Earnings per share |
|
| 2009 $ |
1.05 |
| % change from 2008 |
-19.8 |
| 1999-2009 annual growth rate % |
13.0 |
| Total return to investors |
% |
| 2009 |
46.9 |
| 1999-2009 annual rate |
-7.7 |
|
Galleries and videos
-

These 20 big employers have more than 60,000 job openings. What are they looking for in a new hire?
-

See the 23 companies that made both the Fortune 500 and Best Companies to Work For lists this year.
Interactives
-
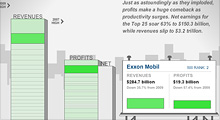
See how revenues and profits at America's 25 largest companies have risen and fallen over the past decade.
-
From a single store in 1962 to more than 4,300 outlets today, see how the biggest retailer has expanded.
|


