| Rank |
Company |
Revenues
($ millions) |
Profits
($ millions) |
| 1 |
Wal-Mart Stores
|
408,214.0 |
14,335.0
|
| 2 |
Exxon Mobil
|
284,650.0 |
19,280.0
|
| 3 |
Chevron
|
163,527.0 |
10,483.0
|
| 4 |
General Electric
|
156,779.0 |
11,025.0
|
| 5 |
Bank of America Corp.
|
150,450.0 |
6,276.0
|
| 6 |
ConocoPhillips
|
139,515.0 |
4,858.0
|
| 7 |
AT&T
|
123,018.0 |
12,535.0
|
| 8 |
Ford Motor
|
118,308.0 |
2,717.0
|
| 9 |
J.P. Morgan Chase & Co.
|
115,632.0 |
11,728.0
|
| 10 |
Hewlett-Packard
|
114,552.0 |
7,660.0
|
| 11 |
Berkshire Hathaway
|
112,493.0 |
8,055.0
|
| 12 |
Citigroup
|
108,785.0 |
-1,606.0
|
| 13 |
Verizon Communications
|
107,808.0 |
3,651.0
|
| 14 |
McKesson
|
106,632.0 |
823.0
|
| 15 |
General Motors
|
104,589.0 |
N.A.
|
| 16 |
American International Group
|
103,189.0 |
-10,949.0
|
| 17 |
Cardinal Health
|
99,612.9 |
1,151.6
|
| 18 |
CVS Caremark
|
98,729.0 |
3,696.0
|
| 19 |
Wells Fargo
|
98,636.0 |
12,275.0
|
| 20 |
International Business Machines
|
95,758.0 |
13,425.0
|
| 21 |
UnitedHealth Group
|
87,138.0 |
3,822.0
|
| 22 |
Procter & Gamble
|
79,697.0 |
13,436.0
|
| 23 |
Kroger
|
76,733.2 |
70.0
|
| 24 |
AmerisourceBergen
|
71,789.0 |
503.4
|
| 25 |
Costco Wholesale
|
71,422.0 |
1,086.0
|
| 26 |
Valero Energy
|
70,035.0 |
-1,982.0
|
| 27 |
Archer Daniels Midland
|
69,207.0 |
1,707.0
|
| 28 |
Boeing
|
68,281.0 |
1,312.0
|
| 29 |
Home Depot
|
66,176.0 |
2,661.0
|
| 30 |
Target
|
65,357.0 |
2,488.0
|
| 31 |
WellPoint
|
65,028.1 |
4,745.9
|
| 32 |
Walgreen
|
63,335.0 |
2,006.0
|
| 33 |
Johnson & Johnson
|
61,897.0 |
12,266.0
|
| 34 |
State Farm Insurance Cos.
|
61,479.6 |
766.7
|
| 35 |
Medco Health Solutions
|
59,804.2 |
1,280.3
|
| 36 |
Microsoft
|
58,437.0 |
14,569.0
|
| 37 |
United Technologies
|
52,920.0 |
3,829.0
|
| 38 |
Dell
|
52,902.0 |
1,433.0
|
| 39 |
Goldman Sachs Group
|
51,673.0 |
13,385.0
|
| 40 |
Pfizer
|
50,009.0 |
8,635.0
|
| 41 |
Marathon Oil
|
49,403.0 |
1,463.0
|
| 42 |
Lowe's
|
47,220.0 |
1,783.0
|
| 43 |
United Parcel Service
|
45,297.0 |
2,152.0
|
| 44 |
Lockheed Martin
|
45,189.0 |
3,024.0
|
| 45 |
Best Buy
|
45,015.0 |
1,003.0
|
| 46 |
Dow Chemical
|
44,945.0 |
648.0
|
| 47 |
Supervalu
|
44,564.0 |
-2,855.0
|
| 48 |
Sears Holdings
|
44,043.0 |
235.0
|
| 49 |
International Assets Holding
|
43,604.4 |
27.6
|
| 50 |
PepsiCo
|
43,232.0 |
5,946.0
|
| 51 |
MetLife
|
41,098.0 |
-2,246.0
|
| 52 |
Safeway
|
40,850.7 |
-1,097.5
|
| 53 |
Kraft Foods
|
40,386.0 |
3,021.0
|
| 54 |
Freddie Mac
|
37,614.0 |
-21,553.0
|
| 55 |
Sysco
|
36,853.3 |
1,055.9
|
| 56 |
Apple
|
36,537.0 |
5,704.0
|
| 57 |
Walt Disney
|
36,149.0 |
3,307.0
|
| 58 |
Cisco Systems
|
36,117.0 |
6,134.0
|
| 59 |
Comcast
|
35,756.0 |
3,638.0
|
| 60 |
FedEx
|
35,497.0 |
98.0
|
| 61 |
Northrop Grumman
|
35,291.0 |
1,686.0
|
| 62 |
Intel
|
35,127.0 |
4,369.0
|
| 63 |
Aetna
|
34,764.1 |
1,276.5
|
| 64 |
New York Life Insurance
|
34,014.3 |
682.7
|
| 65 |
Prudential Financial
|
32,688.0 |
3,124.0
|
| 66 |
Caterpillar
|
32,396.0 |
895.0
|
| 67 |
Sprint Nextel
|
32,260.0 |
-2,436.0
|
| 68 |
Allstate
|
32,013.0 |
854.0
|
| 69 |
General Dynamics
|
31,981.0 |
2,394.0
|
| 70 |
Morgan Stanley
|
31,515.0 |
1,346.0
|
| 71 |
Liberty Mutual Insurance Group
|
31,094.0 |
1,023.0
|
| 72 |
Coca-Cola
|
30,990.0 |
6,824.0
|
| 73 |
Humana
|
30,960.4 |
1,039.7
|
| 74 |
Honeywell International
|
30,908.0 |
2,153.0
|
| 75 |
Abbott Laboratories
|
30,764.7 |
5,745.8
|
| 76 |
News Corp.
|
30,423.0 |
-3,378.0
|
| 77 |
HCA
|
30,052.0 |
1,054.0
|
| 78 |
Sunoco
|
29,630.0 |
-329.0
|
| 79 |
Hess
|
29,569.0 |
740.0
|
| 80 |
Ingram Micro
|
29,515.4 |
202.1
|
| 81 |
Fannie Mae
|
29,065.0 |
-71,969.0
|
| 82 |
Time Warner
|
28,842.0 |
2,468.0
|
| 83 |
Johnson Controls
|
28,497.0 |
-338.0
|
| 84 |
Delta Air Lines
|
28,063.0 |
-1,237.0
|
| 85 |
Merck
|
27,428.3 |
12,901.3
|
| 86 |
DuPont
|
27,328.0 |
1,755.0
|
| 87 |
Tyson Foods
|
27,165.0 |
-537.0
|
| 88 |
American Express
|
26,730.0 |
2,130.0
|
| 89 |
Rite Aid
|
26,289.5 |
-2,915.4
|
| 90 |
TIAA-CREF
|
26,278.0 |
-459.1
|
| 91 |
CHS
|
25,729.9 |
381.4
|
| 92 |
Enterprise GP Holdings
|
25,510.9 |
204.1
|
| 93 |
Massachusetts Mutual Life Insurance
|
25,423.6 |
-115.1
|
| 94 |
Philip Morris International
|
25,035.0 |
6,342.0
|
| 95 |
Raytheon
|
24,881.0 |
1,935.0
|
| 96 |
Express Scripts
|
24,748.9 |
827.6
|
| 97 |
Hartford Financial Services
|
24,701.0 |
-887.0
|
| 98 |
Travelers Cos.
|
24,680.0 |
3,622.0
|
| 99 |
Publix Super Markets
|
24,515.0 |
1,161.4
|
| 100 |
Amazon.com
|
24,509.0 |
902.0
|
|
Interactives
-
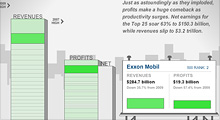
See how revenues and profits at America's 25 largest companies have risen and fallen over the past decade.
-
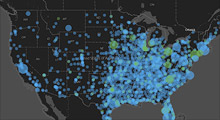
From a single store in 1962 to more than 4,300 outlets today, see how the biggest retailer has expanded.
|


