Fannie Mae and Chesapeake Energy are two of more than 95 FORTUNE 500 companies that lost money last year.
| Company |
Fortune
500 rank |
Loss ($ millions) |
| Fannie Mae | 81 | 71,969.0* | | Freddie Mac | 54 | 21,553.0* | | American International Group | 16 | 10,949.0* | | GMAC | 122 | 10,298.0 | | Symantec | 353 | 6,728.9 | | Chesapeake Energy | 296 | 5,830.0 | | CC Media Holdings | 376 | 4,034.1* | | News Corp. | 76 | 3,378.0 | | Rite Aid | 89 | 2,915.4* | | Supervalu | 47 | 2,855.0 | | Devon Energy | 261 | 2,479.0* | | Sprint Nextel | 67 | 2,436.0* | | MetLife | 51 | 2,246.0 | | Sun Microsystems | 204 | 2,234.0 | | Valero Energy | 26 | 1,982.0* | | State Street Corp. | 249 | 1,881.0 | | Micron Technology | 432 | 1,835.0* | | Citigroup | 12 | 1,606.0* | | SunTrust Banks | 224 | 1,563.7 | | AbitibiBowater | 472 | 1,553.0* | | AMR | 120 | 1,468.0* | | United States Steel | 211 | 1,401.0 | | KeyCorp | 356 | 1,335.0* | | MGM Mirage | 360 | 1,291.7* | | Delta Air Lines | 84 | 1,237.0* | | ArvinMeritor | 450 | 1,212.0* | | Jabil Circuit | 199 | 1,165.2 | | Alcoa | 127 | 1,151.0* | | Avnet | 142 | 1,122.5 | | SunGard Data Systems | 380 | 1,118.0* | | Oshkosh | 386 | 1,098.8 | | Safeway | 52 | 1,097.5 | | Electronic Arts | 494 | 1,088.0* | | First Data | 250 | 1,086.4* | | Bank of New York Mellon Corp. | 274 | 1,084.0 | | Regions Financial | 254 | 1,031.3* | | Boston Scientific | 279 | 1,025.0* | | Hartford Financial Services | 97 | 887.0* | | Avery Dennison | 362 | 746.7 | | UAL | 140 | 651.0* | | YRC Worldwide | 396 | 622.0* | | Office Depot | 192 | 596.5* | | Virgin Media | 359 | 559.8* | | Blockbuster | 500 | 558.2* | | Weyerhaeuser | 379 | 545.0* | | El Paso | 447 | 539.0* | | Tyson Foods | 87 | 537.0 | | Lincoln National | 256 | 484.7 | | Genworth Financial | 257 | 460.0* | | TIAA-CREF | 90 | 459.1* | | Dana Holding | 398 | 431.0 | | Liberty Global | 210 | 412.1* | | Terex | 402 | 398.4 | | Goodyear Tire & Rubber | 141 | 375.0* | | Las Vegas Sands | 456 | 354.5* | | Western Refining | 330 | 350.6 | | Marriott International | 213 | 346.0 | | Johnson Controls | 83 | 338.0 | | Sunoco | 78 | 329.0 | | Applied Materials | 421 | 305.3 | | Nucor | 206 | 293.6 | | Apache | 271 | 284.4 | | Continental Airlines | 183 | 282.0* | | Host Hotels & Resorts | 492 | 252.0 | | Eastman Kodak | 297 | 210.0* | | US Airways Group | 222 | 205.0* | | Smithfield Foods | 163 | 190.3 | | Masco | 291 | 183.0* | | Pilgrim's Pride | 317 | 151.6* | | Tesoro | 139 | 140.0 | | Great Atlantic & Pacific Tea | 247 | 139.9* | | Sanmina-SCI | 405 | 136.2* | | Anadarko Petroleum | 260 | 135.0 | | Hertz Global Holdings | 318 | 126.0* | | MDU Resources Group | 498 | 123.3 | | Massachusetts Mutual Life Insurance | 93 | 115.1* | | Con-way | 483 | 107.7 | | Kelly Services | 479 | 104.5* | | TravelCenters of America | 440 | 89.9* | | Frontier Oil | 488 | 83.8 | | Tenneco | 446 | 73.0* | | Integrys Energy Group | 302 | 70.9 | | Live Nation Entertainment | 490 | 60.2* | | Harley-Davidson | 430 | 55.1 | | Motorola | 110 | 51.0* | | Health Net | 146 | 49.0 | | Thrivent Financial for Lutherans | 342 | 48.4* | | Avis Budget Group | 409 | 47.0* | | NCR | 451 | 33.0 | | Agilent Technologies | 461 | 31.0 | | Textron | 220 | 31.0 | | Anixter International | 422 | 29.3 | | R.R. Donnelley & Sons | 240 | 27.3* | | Mutual of Omaha Insurance | 408 | 17.9* | | Manpower | 143 | 9.2 | | Aramark | 189 | 6.9 | | Mohawk Industries | 392 | 5.5* |
|
Interactives
-
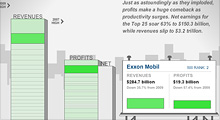
See how revenues and profits at America's 25 largest companies have risen and fallen over the past decade.
-
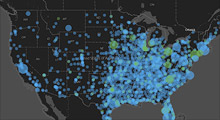
From a single store in 1962 to more than 4,300 outlets today, see how the biggest retailer has expanded.
|


