| Rank |
Company |
Revenues
($ millions) |
Profits
($ millions) |
| 401 |
Pacific Life
|
5,211.0 |
434.0
|
| 402 |
Terex
|
5,205.0 |
-398.4
|
| 403 |
Universal Health Services
|
5,202.4 |
260.4
|
| 404 |
Amerigroup
|
5,188.1 |
149.3
|
| 405 |
Sanmina-SCI
|
5,177.5 |
-136.2
|
| 406 |
Jarden
|
5,152.6 |
128.7
|
| 407 |
Tutor Perini
|
5,152.0 |
137.1
|
| 408 |
Mutual of Omaha Insurance
|
5,149.6 |
-17.9
|
| 409 |
Avis Budget Group
|
5,131.0 |
-47.0
|
| 410 |
Autoliv
|
5,120.7 |
10.0
|
| 411 |
MasterCard
|
5,098.7 |
1,462.5
|
| 412 |
Mylan
|
5,092.8 |
232.6
|
| 413 |
Western Union
|
5,083.6 |
848.8
|
| 414 |
Celanese
|
5,082.0 |
488.0
|
| 415 |
Eastman Chemical
|
5,047.0 |
136.0
|
| 416 |
Telephone & Data Systems
|
5,020.7 |
193.9
|
| 417 |
Polo Ralph Lauren
|
5,018.9 |
406.0
|
| 418 |
Auto-Owners Insurance
|
5,017.1 |
327.1
|
| 419 |
Core-Mark Holding
|
5,015.6 |
47.3
|
| 420 |
Western & Southern Financial Group
|
5,014.4 |
14.3
|
| 421 |
Applied Materials
|
5,013.6 |
-305.3
|
| 422 |
Anixter International
|
4,982.4 |
-29.3
|
| 423 |
CenturyTel
|
4,974.2 |
647.2
|
| 424 |
Atmos Energy
|
4,969.1 |
191.0
|
| 425 |
Universal American
|
4,963.5 |
140.3
|
| 426 |
Ryder System
|
4,957.6 |
61.9
|
| 427 |
SPX
|
4,935.9 |
31.7
|
| 428 |
Foot Locker
|
4,854.0 |
48.0
|
| 429 |
O'Reilly Automotive
|
4,847.1 |
307.5
|
| 430 |
Harley-Davidson
|
4,838.6 |
-55.1
|
| 431 |
Holly
|
4,834.3 |
19.6
|
| 432 |
Micron Technology
|
4,803.0 |
-1,835.0
|
| 432 |
Owens Corning
|
4,803.0 |
64.0
|
| 434 |
EOG Resources
|
4,787.0 |
546.6
|
| 435 |
Black & Decker
|
4,775.1 |
132.5
|
| 436 |
Big Lots
|
4,726.8 |
200.4
|
| 437 |
Spectra Energy
|
4,725.0 |
848.0
|
| 438 |
Starwood Hotels & Resorts
|
4,712.0 |
73.0
|
| 439 |
United Stationers
|
4,710.3 |
101.0
|
| 440 |
TravelCenters of America
|
4,699.8 |
-89.9
|
| 441 |
BlackRock
|
4,699.3 |
875.1
|
| 442 |
Laboratory Corp. of America
|
4,694.7 |
543.3
|
| 443 |
Health Management Associates
|
4,687.3 |
138.2
|
| 444 |
NYSE Euronext
|
4,687.0 |
219.0
|
| 445 |
St. Jude Medical
|
4,681.3 |
777.2
|
| 446 |
Tenneco
|
4,649.0 |
-73.0
|
| 447 |
El Paso
|
4,631.0 |
-539.0
|
| 448 |
Wesco International
|
4,624.0 |
105.1
|
| 449 |
Consol Energy
|
4,621.9 |
539.7
|
| 450 |
ArvinMeritor
|
4,617.0 |
-1,212.0
|
| 451 |
NCR
|
4,612.0 |
-33.0
|
| 452 |
Unisys
|
4,597.7 |
189.3
|
| 453 |
Lubrizol
|
4,586.3 |
500.8
|
| 454 |
Alliant Techsystems
|
4,583.2 |
155.1
|
| 455 |
Washington Post
|
4,569.7 |
92.8
|
| 456 |
Las Vegas Sands
|
4,563.1 |
-354.5
|
| 457 |
Group 1 Automotive
|
4,525.7 |
34.8
|
| 458 |
Genzyme
|
4,515.5 |
422.3
|
| 459 |
Allergan
|
4,503.6 |
621.3
|
| 460 |
Broadcom
|
4,490.3 |
65.3
|
| 461 |
Agilent Technologies
|
4,481.0 |
-31.0
|
| 462 |
Rockwell Collins
|
4,470.0 |
594.0
|
| 463 |
W.R. Berkley
|
4,431.2 |
309.1
|
| 464 |
PepsiAmericas
|
4,421.3 |
181.2
|
| 465 |
Charles Schwab
|
4,414.0 |
787.0
|
| 466 |
Dick's Sporting Goods
|
4,412.8 |
135.4
|
| 467 |
FMC Technologies
|
4,405.4 |
361.8
|
| 468 |
NII Holdings
|
4,397.6 |
381.5
|
| 469 |
General Cable
|
4,385.2 |
108.7
|
| 470 |
Graybar Electric
|
4,377.9 |
37.3
|
| 471 |
Biogen Idec
|
4,377.3 |
970.1
|
| 472 |
AbitibiBowater
|
4,366.0 |
-1,553.0
|
| 473 |
Flowserve
|
4,365.3 |
427.9
|
| 474 |
Airgas
|
4,349.5 |
261.1
|
| 475 |
Conseco
|
4,341.4 |
85.7
|
| 476 |
Rockwell Automation
|
4,332.5 |
220.7
|
| 477 |
Kindred Healthcare
|
4,326.3 |
40.1
|
| 478 |
American Financial Group
|
4,320.6 |
519.3
|
| 479 |
Kelly Services
|
4,314.8 |
-104.5
|
| 480 |
Spectrum Group International
|
4,293.3 |
7.1
|
| 481 |
RadioShack
|
4,276.0 |
205.0
|
| 482 |
CA
|
4,271.0 |
694.0
|
| 483 |
Con-way
|
4,269.2 |
-107.7
|
| 484 |
Erie Insurance Group
|
4,255.4 |
108.5
|
| 485 |
Casey's General Stores
|
4,251.5 |
85.7
|
| 486 |
Centene
|
4,248.0 |
83.7
|
| 487 |
Sealed Air
|
4,242.8 |
244.3
|
| 488 |
Frontier Oil
|
4,237.2 |
-83.8
|
| 489 |
Scana
|
4,237.0 |
348.0
|
| 490 |
Live Nation Entertainment
|
4,232.0 |
-60.2
|
| 491 |
Fiserv
|
4,224.0 |
476.0
|
| 492 |
Host Hotels & Resorts
|
4,216.0 |
-252.0
|
| 493 |
H&R Block
|
4,213.4 |
485.7
|
| 494 |
Electronic Arts
|
4,212.0 |
-1,088.0
|
| 495 |
Franklin Resources
|
4,194.1 |
896.8
|
| 496 |
Wisconsin Energy
|
4,193.2 |
382.4
|
| 497 |
Northern Trust Corp.
|
4,193.1 |
864.2
|
| 498 |
MDU Resources Group
|
4,176.5 |
-123.3
|
| 499 |
CB Richard Ellis Group
|
4,165.8 |
33.3
|
| 500 |
Blockbuster
|
4,161.8 |
-558.2
|
|
Interactives
-
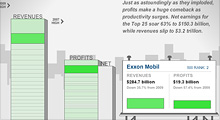
See how revenues and profits at America's 25 largest companies have risen and fallen over the past decade.
-
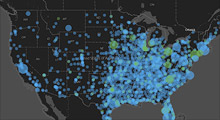
From a single store in 1962 to more than 4,300 outlets today, see how the biggest retailer has expanded.
|


