Search News

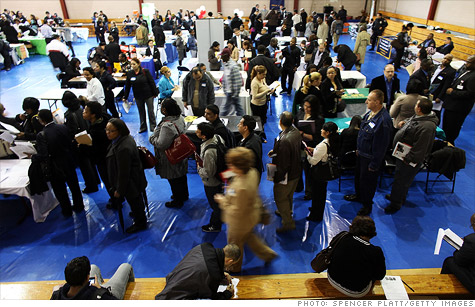
Job seekers at a recent jobs fair in New York City.
NEW YORK (CNNMoney) -- The number of job openings fell in April, the Labor Department reported Tuesday, another sign of weakness in the U.S. labor market.
The report showed 3.4 million open positions for the month, down 8.7% from the 3.7 million openings in March.
The drop in available jobs means there are 3.7 unemployed job seekers for each opening, up from 3.4 in March, meaning there is greater competition for the available jobs.
While that's a big improvement from the record high of 6.7 unemployed people for each opening in July 2009, it's far worse than the 1.6 unemployed per opening in November 2007, the month before the recession began.
Tuesday's report also showed a slight drop in the number of people hired in April and an increase in those fired or laid-off. The number of people who quit jobs, a measure of confidence in the job market, also declined, dropping 89,000 to 2.1 million.
"It confirms that the economy has lost some momentum," said economist Robert Brusca of FAO Economics. "And we don't know when it will pick up again. It looks like there's still weakness across various regions and industries."
Job growth was strong for several months at the start of 2012, with employers adding an average of more than 250,000 jobs a month from December through February. But hiring has slowed significantly since then, with fewer than 80,000 jobs added in both April and May.
The decline in openings was broad-based. While several industries -- including construction, hospitality and health care -- reported a drop of only a few thousand jobs, no industry saw an increase in the number of openings.
And some sectors reported deep declines, with business and professional services having 108,000 fewer jobs available and manufacturers looking for 68,000 fewer people. There was also a drop of more than 40,000 job listings among retailers and various units of government. ![]()
| Overnight Avg Rate | Latest | Change | Last Week |
|---|---|---|---|
| 30 yr fixed | 3.80% | 3.88% | |
| 15 yr fixed | 3.20% | 3.23% | |
| 5/1 ARM | 3.84% | 3.88% | |
| 30 yr refi | 3.82% | 3.93% | |
| 15 yr refi | 3.20% | 3.23% |
Today's featured rates:
| Latest Report | Next Update |
|---|---|
| Home prices | Aug 28 |
| Consumer confidence | Aug 28 |
| GDP | Aug 29 |
| Manufacturing (ISM) | Sept 4 |
| Jobs | Sept 7 |
| Inflation (CPI) | Sept 14 |
| Retail sales | Sept 14 |