Search News

U.S. greenhouse gas emissions are falling despite lack of action from Congress. The biggest reason: cheap natural gas.
NEW YORK (CNNMoney) -- A curious thing is happening to the air in the United States. It's getting cleaner.
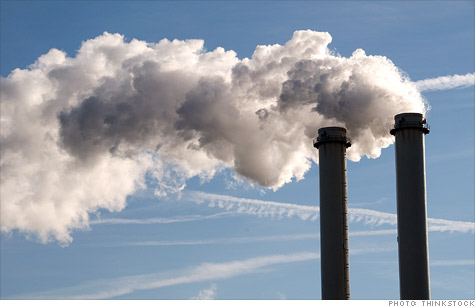
Despite there being no real effort by Congress to address global warming and America's longstanding reputation as an energy hog, U.S. carbon dioxide emissions are falling.
The lackluster economy has something to do with it. But it doesn't fully explain what's happening. Consider that even factoring in a stronger economy, forecasters see greenhouse gas emissions continuing to fall.
It's possible the country may meet its pledge to reduce emissions 17% by 2020.
So what's going on?
Some of the reductions can be attributed to executive decisions taken by the Obama administration to curb pollution from power plants and other sources.
Investments in energy efficiency have also helped, along with state rules requiring utilities to purchase power from renewable sources.
But the main and most surprising reason: cheap natural gas.
"The primary reason by far is low natural gas prices," said Robert Stavins, director of the environmental economics program at Harvard.
Natural gas prices are so low largely thanks to hydraulic fracturing. Known as fracking, the process uses sand, chemicals, water and pressure to crack shale rock and allow the gas to flow.
While the practice has raised fears over ground water contamination and other issues, it's unleashed an energy boom in the United States that's taken gas prices to their lowest levels in a decade.
That's allowed utilities to replace some coal-fired power plants with ones that run on natural gas -- which emits about half as much pollution as coal.
The numbers are fairly impressive. The United States has cut carbon emissions from its energy sector by about 9% since 2007, according to the U.S. Energy Information Administration.
All this has been accomplished without the cap and trade law Congress fiercely debated in 2009.
Europe, by contrast, has seen its energy-sector carbon emissions remain basically flat. This despite the fact that most of Europe operates under a market-based cap-and-trade scheme where emissions are capped at a certain level and companies get tradable credits to emit pollution.
Plus, Europe has significantly higher taxes on energy.
Some note that the Untied States consumes more energy than Europe overall, and so has had an easier time finding and reducing inefficiencies.
They also note that when counting all greenhouse gas emissions -- not just those produced by the energy sector -- Europe's emissions dropped 9% from 2005 to 2010 while U.S. emissions fell by just 5%.
But others take the U.S. success in reducing its energy sector emissions as a sign that its fragmented, state-based, regulatory approach has worked better than Europe's market-based cap-and-trade approach.
"The cap-and-trade system in Europe has not delivered to date," said Geir Vollsaeter, head of the energy and environmental consultancy Green World Advisors and former climate change specialist at Royal Dutch Shell. "Other tools in the tool box seem to be more efficient."
Both Vollsaeter and Stavins agree that the world needs to do more.
A 17% reduction from the United States by 2020 is roughly what the failed U.S. cap-and-trade bill was expected to achieve.
But that bill was also expected to bring about an 80% reduction by 2050 -- the level scientists say is necessary to head off potentially catastrophic impacts from climate change.
Natural gas is only so clean, it won't produce those kinds of cuts. Plus, emissions from the developing world haven't begun to be tackled.
In order to meet the goal of cutting greenhouse gasses by 80% the world needs more solutions for today and beyond 2020 as well. ![]()
| Overnight Avg Rate | Latest | Change | Last Week |
|---|---|---|---|
| 30 yr fixed | 3.80% | 3.88% | |
| 15 yr fixed | 3.20% | 3.23% | |
| 5/1 ARM | 3.84% | 3.88% | |
| 30 yr refi | 3.82% | 3.93% | |
| 15 yr refi | 3.20% | 3.23% |
Today's featured rates:
| Latest Report | Next Update |
|---|---|
| Home prices | Aug 28 |
| Consumer confidence | Aug 28 |
| GDP | Aug 29 |
| Manufacturing (ISM) | Sept 4 |
| Jobs | Sept 7 |
| Inflation (CPI) | Sept 14 |
| Retail sales | Sept 14 |