| Key financials |
$ millions |
% change
from 2008 |
| Revenues |
150,450.0 |
33.0 |
| Profits |
6,276.0 |
56.6 |
| Assets |
2,223,299.0 |
— |
| Stockholders' equity |
231,444.0 |
— |
| Market value (3/26/2010) |
179,572.9 |
— |
| Profits as % of |
|
| Revenues |
4.2 |
| Assets |
0.3 |
| Stockholders' equity |
2.7 |
| Earnings per share |
|
| 2009 $ |
-0.29 |
| % change from 2008 |
-152.7 |
| 1999-2009 annual growth rate % |
N.A. |
| Total return to investors |
% |
| 2009 |
7.3 |
| 1999-2009 annual rate |
-1.0 |
| 4 | Wells Fargo | 19 | 98,636.0 | | 5 | Goldman Sachs Group | 39 | 51,673.0 | | 6 | Morgan Stanley | 70 | 31,515.0 | | 7 | American Express | 88 | 26,730.0 | | 8 | U.S. Bancorp | 121 | 19,490.0 | | 9 | GMAC | 122 | 19,403.0 | | 10 | PNC Financial Services Group | 123 | 19,231.0 | | 11 | Capital One Financial | 144 | 15,980.1 | | 12 | BB&T Corp. | 217 | 10,818.0 | | 13 | SunTrust Banks | 224 | 10,420.0 | | 14 | Fifth Third Bancorp | 248 | 9,450.0 | | 15 | State Street Corp. | 249 | 9,362.0 | | 16 | Regions Financial | 254 | 9,087.1 | | 17 | Bank of New York Mellon Corp. | 274 | 8,345.0 | | 18 | Discover Financial Services | 286 | 7,985.7 | | 19 | KeyCorp | 356 | 6,068.0 | | 20 | Northern Trust Corp. | 497 | 4,193.1 |
|
Galleries and videos
-

These 20 big employers have more than 60,000 job openings. What are they looking for in a new hire?
-

Even as the market soared last year, these Fortune 500 stocks delivered lousy returns to investors.
Interactives
-

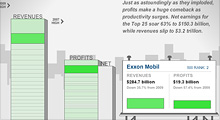
See how revenues and profits at America's 25 largest companies have risen and fallen over the past decade.
-

From a single store in 1962 to more than 4,300 outlets today, see how the biggest retailer has expanded.
|
