4. US Natural Gas Fund
Ticker: UNG
Year-to-date return: -26.53%
Market capitalization: $1.1 billion
Expense ratio : 0.98%

Hydraulic fracking, a relatively new process for drilling natural gas, has made the United States awash in natural gas. But demand hasn't kept up with the seemingly endless new domestic supplies.

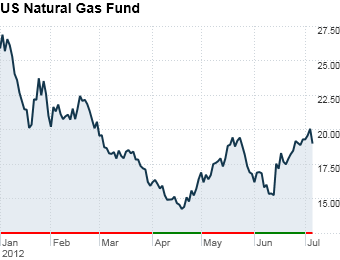
Natural gas prices of $2.50 per BTU (British Thermal Unit) are roughly half of where they were last year.

Natural gas ETFs track futures prices so they wind up buying higher priced contracts, only to sell them at the end of each month at a loss since spot, or daily, prices tend to be lower.

The unusually hot summer in the U.S. has pushed up natural gas prices somewhat as the heat has increased demand. Longer-term, some analysts see prices moving even higher as U.S. consumers start looking at natural gas as an alternative energy source.


All data from global ETF research firm XTF as of market's close on July 6, 2012.
By Maureen Farrell @CNNMoneyInvest - Last updated July 18 2012: 9:09 PM ET
Join the Conversation
6 best performing ETFs

Despite the ups and downs in the broader market, these ETFs are still enjoying double-digit gains this year.

Fear & Greed
Sponsored by
Most Popular


Most stock quote data provided by BATS. Market indices are shown in real time, except for the DJIA, which is delayed by two minutes. All times are ET. Disclaimer. Morningstar: © 2018 Morningstar, Inc. All Rights Reserved. Factset: FactSet Research Systems Inc. 2018. All rights reserved. Chicago Mercantile Association: Certain market data is the property of Chicago Mercantile Exchange Inc. and its licensors. All rights reserved. Dow Jones: The Dow Jones branded indices are proprietary to and are calculated, distributed and marketed by DJI Opco, a subsidiary of S&P Dow Jones Indices LLC and have been licensed for use to S&P Opco, LLC and CNN. Standard & Poor's and S&P are registered trademarks of Standard & Poor's Financial Services LLC and Dow Jones is a registered trademark of Dow Jones Trademark Holdings LLC. All content of the Dow Jones branded indices © S&P Dow Jones Indices LLC 2018 and/or its affiliates.