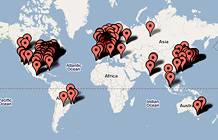
| 1 | Exxon Mobil | 2 | 40,610.0 | 2.8 | | 2 | Royal Dutch Shell | 3 | 31,331.0 | 23.1 | | 3 | General Electric | 12 | 22,208.0 | 6.6 | | 4 | BP | 4 | 20,845.0 | -5.3 | | 5 | Gazprom | 47 | 19,269.2 | -5.2 | | 6 | HSBC Holdings | 20 | 19,133.0 | 21.2 | | 7 | Chevron | 6 | 18,688.0 | 9.0 | | 8 | Petronas | 95 | 18,118.4 | 40.9 | | 9 | Total | 8 | 18,041.7 | 22.2 | | 10 | J.P. Morgan Chase & Co. | 32 | 15,365.0 | 6.4 | | 11 | Royal Bank of Scotland | 36 | 15,103.0 | 28.4 | | 12 | Toyota Motor | 5 | 15,042.5 | 7.0 | | 13 | Bank of America Corp. | 28 | 14,982.0 | -29.1 | | 14 | China National Petroleum | 25 | 14,925.3 | 12.5 | | 15 | Microsoft | 136 | 14,065.0 | 11.6 | | 16 | ENI | 27 | 13,702.7 | 18.5 | | 17 | BHP Billiton | 183 | 13,416.0 | 28.4 | | 18 | Vodafone | 85 | 13,366.1 | N.A. | | 19 | Berkshire Hathaway | 30 | 13,213.0 | 20.0 | | 20 | Petrobras | 63 | 13,138.0 | 2.4 | | 21 | Rosneft Oil | 203 | 12,862.0 | 264.1 | | 22 | Akzo Nobel | 455 | 12,770.6 | 782.8 | | 23 | Wal-Mart Stores | 1 | 12,731.0 | 12.8 | | 24 | ING Group | 7 | 12,648.7 | 31.1 | | 25 | Santander Central Hispano Group | 58 | 12,401.3 | 30.1 | | 26 | Telefónica | 76 | 12,190.2 | 55.9 | | 27 | AT&T | 29 | 11,951.0 | 62.5 | | 28 | Novartis | 181 | 11,946.0 | 66.5 | | 29 | ConocoPhillips | 10 | 11,891.0 | -23.5 | | 30 | CVRD | 235 | 11,825.0 | 81.1 | | 31 | Goldman Sachs Group | 61 | 11,599.0 | 21.6 | | 32 | Allianz | 22 | 10,903.6 | 23.8 | | 33 | Industrial & Commercial Bank of China | 133 | 10,717.8 | 73.4 | | 34 | BNP Paribas | 21 | 10,706.5 | 16.8 | | 35 | Johnson & Johnson | 107 | 10,576.0 | -4.3 | | 36 | GlaxoSmithKline | 151 | 10,431.5 | 5.2 | | 37 | International Business Machines | 46 | 10,418.0 | 9.8 | | 38 | ArcelorMittal | 39 | 10,368.0 | 98.4 | | 39 | Procter & Gamble | 79 | 10,340.0 | 19.1 | | 40 | Intesa Sanpaolo | 144 | 9,923.5 | 209.1 | | 41 | Nokia | 88 | 9,861.9 | 82.5 | | 42 | E.ON | 52 | 9,860.6 | 55.4 | | 43 | Altria Group | 190 | 9,786.0 | -18.6 | | 44 | Lukoil | 90 | 9,511.0 | 27.1 | | 45 | China Construction Bank | 171 | 9,078.7 | 56.3 | | 46 | Nestlé | 57 | 8,874.5 | 21.0 | | 47 | Deutsche Bank | 26 | 8,861.4 | 18.0 | | 48 | Barclays | 70 | 8,836.9 | 5.1 | | 49 | France Télécom | 84 | 8,623.2 | 66.1 | | 50 | China Mobile Communications | 148 | 8,426.1 | 34.6 |
|
From the July 21, 2008 issue
|
|
|


