Green shoots? Check the yield curve
The gap between the 2-year and 10-year Treasury yield is widening, a sign that typically indicates the economy is getting healthier.
NEW YORK (CNNMoney.com) -- If you're looking for a sign that the economy may be on the mend, look no further than the Treasury yield curve -- a closely monitored harbinger of the economy.
The benchmark yield curve measures the difference between the 2-year and 10-year note yields.
When the spread between the two yields widens, it typically signals that the economy is headed for recovery. That's largely because it is viewed as the market rewarding investors for putting their cash away for a longer period of time.
When the spread narrows, or even becomes negative, it typically signals that the economy is headed for rough waters because it means that jittery investors are desperate to sink their cash in a short-term bunker trade.
On Wednesday, the spread between the 2-year and 10-year notes widened to 2.38%, or 238 basis points, marking its broadest since mid-November. It pulled back to 235 after the Federal Reserve released the minutes of its latest meeting. But to show just how wary investors had become, the spread was a full 100 basis smaller in late December.
Does this give investors reasons to cheer? Well, yes and no, said David Ader, head of government bond strategy at RBS.
"Traditionally, the answer is yes [but] we have never dealt with this type of a deficit before ever, ever, ever," said Ader. "It is not clear to me that this steepening that we are seeing here is a sign that the economy is coming out of a recession."
Government debt is considered one of the safest places to invest. In times of financial market turmoil, short-term Treasury prices skyrocket, thus lowering the yield. Government debt prices and yields move in opposite directions.
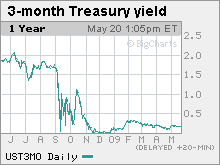
In early December, for example, the yield for the 3-month Treasury bill bottomed out all the way to zero, indicating that investors were more concerned with keeping their investments safe than making any kind of a profit.
Fed's role. Economist say the widening of the benchmark spread may have more to do with the government's never-before-seen attempts to right the staggering economy than as an indication the economy is in recovery mode.
The Federal Reserve has kept its key rate at a target range of between 0% and 0.25% since December in an effort to spur lending.
The front end of the yield curve, including the 2-year note, is tied closely to the Federal Reserve's key lending rate. "You have a front end that is locked," said Ader. "It fluctuates 10 or 15 basis points up or down," but as long as the Fed's hands are tied to keeping interest rates low, then so are shorter term Treasury yields.
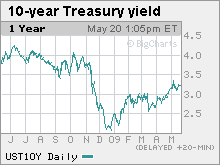
It's all in the 10-year. With the 2-year note at a virtual standstill, much of the spread's movement is being led by the 10-year note, which has seen its yield rise above 3% in recent weeks.
In mid-December, the 10-year yield was just over 2%. Wednesday, it was hovering near 3.13%. (Full story)
"The end of last year - the last quarter of 2008 - was panic," said Ader. Investors were freaked out as major financial institutions were crumbling and Wall Street was sinking. As part of "the great deleveraging trade," investors sold out of everything except Uncle Sam's debt, and "that gave the 10-year sector something of an exaggerated bid."
Furthermore, the government unveiled unprecedented spending initiatives to prop up financial institutions and restore investor confidence. The government started backing debt and buying mortgage backed securities. In order to pay for the various stimulus programs, the government has had to bring a record amount of new issuance to market. The sheer volume of supply has put downward pressure on bond prices, sending yields higher.
In an effort to try to stabilize sinking Treasury prices and rapidly rising yields, the government entered into a program of quantitative easing, where it set out to buy back its own debt. The Fed announced it would buy $300 billion of long-term Treasurys through August in order to stimulate demand.
"Even though the Treasury has bought back $300 billion, it pales in comparison to the size of these other programs," said Ader. The supply of debt that has been flooding the market is sending bond yields higher, widening that 2-10 year spread.
Inflation worries. As the government spends at a breakneck pace in order to jumpstart the economy, some economists fear that inflation will turn around to bite the recovery efforts.
Fears of inflation would also pressure the prices of longer maturity Treasurys, sending those yields higher. While Ader admits that inflation could end up affecting the market down the road, he said that the "supply dynamics" in the Treasury market were overwhelming the effect of inflation.
He noted that gold and inflation protected bonds - or TIPS - have been holding relatively steady. If inflation fears were dominating investor woes, those marketplaces would show more action.
The spread in the benchmark yield curve has more complex factors widening it than in other periods of economic slowdown. "Interest rates may not indicate that there is a recovery right around the corner," said Ader, "or if it is, it is a corner way down the road." ![]()


