Where to find the fattest paychecks
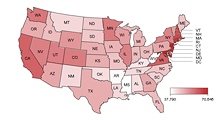
Census Bureau reports that Maryland had the highest median income level in 2008, at $70,545, while Mississippi ranked very last with $37,790.
NEW YORK (CNNMoney.com) -- Maryland is the nation's top-earning state for the third year in a row, with a median household income of $70,545 in 2008, according to a U.S. Census Bureau report released Monday.
The states with highest median incomes are concentrated in the far West and in the Northeast, around the District of Columbia.
Most of the lowest-earning states are in the South. Mississippi had the lowest median income of just $37,790, while West Virginia ($37,989), Arkansas ($38,815), Kentucky ($41,538), and Alabama ($42,538), round out the bottom five
The four highest earning states after Maryland, are New Jersey, which has a median household income of $70,378, Connecticut ($68,595), Alaska ($68,460) and Hawaii ($67,214).
But if you're thinking of moving to Maryland in search of big bucks think twice. While Maryland's median income is nearly twice that of Mississippi, the locals there aren't necessarily walking around with twice as much money in their pockets, because of the difference in the cost of living in each region.
"It's very important to compare cost of living," said Erol Yildirim, chief economist for the Council for Community and Economic Research. "Purchasing power is very different for different areas."
And the cost of living in Bethesda, Md., is about 52% higher than it is in Tupelo, Miss., according to Yildirim. A dozen eggs costs $1.93 in Bethesda, compared with $1.50 in Tupelo, while a loaf of bread is $1.66 compared with $1.37.
And there is a huge difference in housing costs. The average apartment rental in Bethesda is $1,464 a month versus just $512 in Tupelo. And the median home price in Bethesda is $529,707 compared with just $220,000 in Tupelo.
Taking these living expenses into account wipes out much of the advantage of Maryland's higher income. Once purchasing power is taken into account, Southern and Midwestern states become much better bargains.
Florida was the only state where median income actually declined, falling 0.01% before adjusting for inflation. Michigan and Montana barely inched up, by about 0.3% in each case. Income in Indiana (1.1%) and Maine (1.5%) also increased very modestly. But with inflation at over 3%, those states were effectively in negative territory.
Louisiana saw the biggest jump in income, up 6.9%. But that may be the result of all the Federal dollars flowing into the area to rebuild it after Katrina. The state's unemployment rate averaged less than 5% during 2008.
Another big winner was the District of Columbia, which saw median income rise 6.7% in a year when the White House changed hands. Alaska (6.4%), Hawaii (6.3%) and Delaware (6.2%) also recorded solid gains.
Brookings Institute demographer William Frey notes that the current economic downturn may have actually given these median income levels a boost. That's because when times get tough, many of the lowest-paying jobs disappear, artificially boosting income statistics.
And many of the workers who hold the lowest-paying jobs are immigrants, who are often highly mobile, and may elect to return home and opt out of the U.S. workforce altogether.
Frey notes that in 2008, the percentage of foreign-born U.S. residents fell to 12.5% from 12.6% in 2007, due mostly to a downturn in net immigration from Mexico, said Frey. "When many low income people leave," said Frey, "median income can go up." ![]()


