Search News

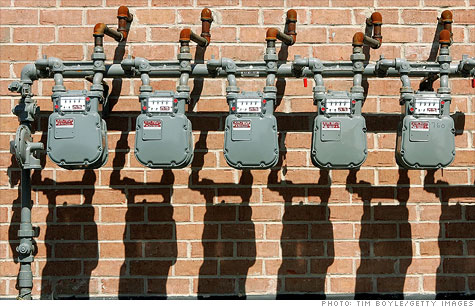
Natural gas meters outisde a residential building in Illinois. Analysts see prices dropping below $2 as slack demand and rising output lead to a supply glut.
NEW YORK (CNNMoney) -- Natural gas future prices hit a 10-year low Thursday as slack demand and rising production continued to fuel an oversupply of the product.
Natural gas futures hit $2.27 per million British thermal units Thursday, the lowest price since early 2002. Prices edged up slightly Friday but were still hovering around the lowest level in a decade.
Lack of demand. About half the homes in the country use natural gas as a heating fuel. So it stands to reason that the unusually warm winter in the United States is the main reason behind the slowdown in demand.
However, the low prices are a boon for consumers: the government's Energy Information Administration says the average homeowner who heats with natural gas will save about $50 this year.
Industrial use is another factor.
Natural gas is often used by heavy industry like paper and steel as an energy source or as an outright feedstock in products like chemicals and fertilizers.
As these industries shifted production abroad over the last decades, industrial demand for natural gas declined.
The recent recession and still-sluggish economy have also more recently acted to suppress demand, although there are signs the low prices are encouraging natural gas producers to relocate plants back to the United States.
Utilities, the third consumer of natural gas, burn the fuel to produce electricity.
Utilities have shut coal-fired power plants in recent years and have begun replacing them with natural gas ones, which are cheaper to build and emit about half the carbon dioxide -- the main culprit behind global warming.
But in the absence of a strong nationwide restrictions on greenhouse gas emissions, this shift is occurring slower than some predicted.
Rising production. The recent ability to extract natural gas from shale rock is the main driver behind the increase in production.
Extracting gas from shale rock is made possible by new horizontal drilling technology and the expanded use of hydraulic fracturing.
Known as fracking, this controversial process involves injecting vast amounts of water, sand and some chemicals deep into the ground at high pressure to crack the shale.
Critics fear it is contaminating the ground water, while the industry maintains it is safe. The government is studying the matter.
What's not in dispute is its impact on production -- EIA says U.S. natural gas output has risen 30% since 2005.
Natural gas producers like Chesapeake (CHK, Fortune 500), Devon (DVN, Fortune 500) and EOG (EOG, Fortune 500) have been trying to cut production to combat the drop in prices, but high oil prices make that difficult -- many natural gas wells also produce oil.
Stephen Schork, publisher of industry newsletter the Schork Report, said Devon recently announced it will shut-in production from all of its wells that produce only natural gas. Still, because the company will run wells that produce both oil and gas at full tilt, its total natural gas production is expected to rise 10%.
"You've got so much gas out on the market, this is a long-term problem," said Schork. "There's a good chance we're going below $2." ![]()
| Index | Last | Change | % Change |
|---|---|---|---|
| Dow | 32,627.97 | -234.33 | -0.71% |
| Nasdaq | 13,215.24 | 99.07 | 0.76% |
| S&P 500 | 3,913.10 | -2.36 | -0.06% |
| Treasuries | 1.73 | 0.00 | 0.12% |
| Company | Price | Change | % Change |
|---|---|---|---|
| Ford Motor Co | 8.29 | 0.05 | 0.61% |
| Advanced Micro Devic... | 54.59 | 0.70 | 1.30% |
| Cisco Systems Inc | 47.49 | -2.44 | -4.89% |
| General Electric Co | 13.00 | -0.16 | -1.22% |
| Kraft Heinz Co | 27.84 | -2.20 | -7.32% |
| Overnight Avg Rate | Latest | Change | Last Week |
|---|---|---|---|
| 30 yr fixed | 3.80% | 3.88% | |
| 15 yr fixed | 3.20% | 3.23% | |
| 5/1 ARM | 3.84% | 3.88% | |
| 30 yr refi | 3.82% | 3.93% | |
| 15 yr refi | 3.20% | 3.23% |
Today's featured rates: