Click chart to track VIX.
NEW YORK (CNNMoney) -- The fear is back.
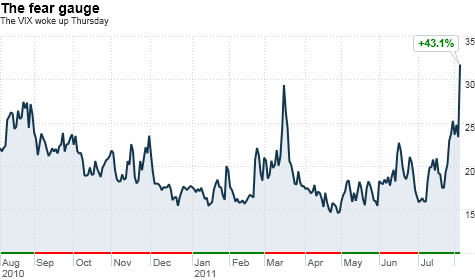
The VIX (VIX) -- or so-called "fear index" -- roused itself from a long hangover on Thursday, surging nearly 36% to 31.78.
That's a big jump for the index, which languished in the 23 to 24 range for much of Wednesday's trading session despite what appeared to be a healthy amount of fear-inducing news.
The VIX topped the elevated levels, just under 30, it hit in mid-March, when the nuclear catastrophe in Japan became front-page news.
A reading of 30 is typically considered a tipping point for fear. The VIX hit an all-time high of 90 during the height of the financial crisis.
One doesn't have to look far for sources of fear. Europe is struggling to contain its debt crisis. Lawmakers in the U.S. flirted with default before cobbling a last-minute deal to raise the debt ceiling.
And economists have been ringing alarm bells after disappointing readings recently on some key economic indicators, including those measuring consumer spending, manufacturing, job cuts and gross domestic product.
Fear is not only manifesting in the VIX -- it's hitting the market.
The Dow (INDU), Nasdaq (COMP) and S&P 500 (SPX) have now erased their gains for the year and are in "correction" territory -- defined as a 10% drop from their cyclical highs. ![]()
| Index | Last | Change | % Change |
|---|---|---|---|
| Dow | 32,627.97 | -234.33 | -0.71% |
| Nasdaq | 13,215.24 | 99.07 | 0.76% |
| S&P 500 | 3,913.10 | -2.36 | -0.06% |
| Treasuries | 1.73 | 0.00 | 0.12% |
| Company | Price | Change | % Change |
|---|---|---|---|
| Ford Motor Co | 8.29 | 0.05 | 0.61% |
| Advanced Micro Devic... | 54.59 | 0.70 | 1.30% |
| Cisco Systems Inc | 47.49 | -2.44 | -4.89% |
| General Electric Co | 13.00 | -0.16 | -1.22% |
| Kraft Heinz Co | 27.84 | -2.20 | -7.32% |
| Overnight Avg Rate | Latest | Change | Last Week |
|---|---|---|---|
| 30 yr fixed | 3.80% | 3.88% | |
| 15 yr fixed | 3.20% | 3.23% | |
| 5/1 ARM | 3.84% | 3.88% | |
| 30 yr refi | 3.82% | 3.93% | |
| 15 yr refi | 3.20% | 3.23% |
Today's featured rates:

