Search News

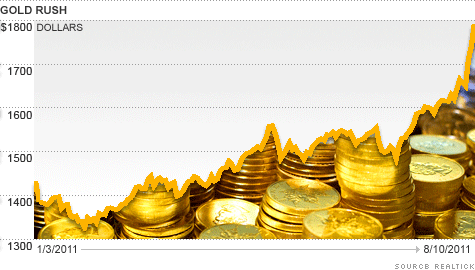
The price of gold has surged from around $1,400 an ounce earlier this year, to trading around $1,800 this week. Click the image for the current price of gold and other commodities.
NEW YORK (CNNMoney) -- Fear is high and investors are fleeing to gold.
Amid a volatile stock market, Europe's debt woes and concerns about a weak U.S. economy, gold touched a new high above $1,800 earlier this week.
It has fluctuated since, and is now back down around $1,750.
Nevertheless, the surge was shocking, considering just earlier this year, the precious metal traded at about $1,400 an ounce. Five years ago, gold cost less than $500.
Granted, the gold market is small compared to stocks or bonds, so it can be dramatically influenced much more easily -- but the numbers can't be disputed -- a gold rush is on.
Wary of the debt crisis debates in July, weak economic data and S&P's credit rating downgrade of the United States, investors have turned to the yellow metal because they perceive it as a tangible safe haven compared to paper currencies, bonds and stocks.
In the last week, traders bought 121,336 contracts for gold futures and options in the Chicago Mercantile Exchange. As of the end of trading Wednesday, investors held 951,623 contracts on COMEX gold, nearing an all-time high of 979,800 contracts in November 2010, according to figures tracked by the Commodity Futures Trading Commission.
Meanwhile, exchange traded funds linked to physical gold had their fourth best week on record, as measured by the dollar amount flowing into those funds.
The world's largest gold ETF, SPDR Gold Trust (GLD), raked in roughly $1.9 billion in the week ending Wednesday, while the smaller but still popular Ishares Comex Gold Trust (IAU) brought in $265 million.
According to filings with the Securities and Exchange Commission, institutional investors (those with assets of $100 million or more) own about 41.9% of GLD's assets and about 32.8% of IAU.
The rest may be a combination of smaller financial managers and average-Joe investors.
"Everyone wants a ticket to the show," said Adam Klopfenstein, senior market strategist with MF Global.
And the demand isn't limited just to gold contracts traded in the exchanges.
Following the S&P downgrade on Friday night, orders for gold bars and coins rushed into the American Precious Metals Exchange -- one of the largest dealers of physical gold.
The company actually had to close down early on Saturday afternoon because it received more orders than it could handle on a single weekend. And the buying continued into Monday.
"On Monday, stocks had one of their worst days in history, and we had our best day in our history," said APMEX CEO Michael Haynes.
Orders range from multi-million dollar shipments to corporate titans, he said, to $50 coins for the man on Main Street.
"Clearly there is a very serious move among U.S. investors to reallocate their portfolios and take a little bit out of their cash, stocks, and bonds into gold," he said. "People are looking for a place to park money while markets settle."
While some analysts predict gold will rise to as high as $2,000 an ounce later this year, experts caution that prices can swing wildly and in the blink of an eye.
"To believe that there is no risk is very foolish," gold options trader Mihir Dange of Arbitrage LLC told CNNMoney's Poppy Harlow. "We're seeing a tremendous amount of volatility." ![]()
| Index | Last | Change | % Change |
|---|---|---|---|
| Dow | 32,627.97 | -234.33 | -0.71% |
| Nasdaq | 13,215.24 | 99.07 | 0.76% |
| S&P 500 | 3,913.10 | -2.36 | -0.06% |
| Treasuries | 1.73 | 0.00 | 0.12% |
| Company | Price | Change | % Change |
|---|---|---|---|
| Ford Motor Co | 8.29 | 0.05 | 0.61% |
| Advanced Micro Devic... | 54.59 | 0.70 | 1.30% |
| Cisco Systems Inc | 47.49 | -2.44 | -4.89% |
| General Electric Co | 13.00 | -0.16 | -1.22% |
| Kraft Heinz Co | 27.84 | -2.20 | -7.32% |
| Overnight Avg Rate | Latest | Change | Last Week |
|---|---|---|---|
| 30 yr fixed | 3.80% | 3.88% | |
| 15 yr fixed | 3.20% | 3.23% | |
| 5/1 ARM | 3.84% | 3.88% | |
| 30 yr refi | 3.82% | 3.93% | |
| 15 yr refi | 3.20% | 3.23% |
Today's featured rates: