CNNMoney.com
Companies Economy International Corrections Pre-market Trading After-hours Trading Winners/Losers/Actives Bonds Currencies Commodities World Markets Money Magazine Real Estate Taxes Jobs Ask the Expert Money 101 Autos Mutual Funds The Help Desk Loan Center Best Places to Live Ask the Expert Ultimate Guide to Retirement Retirement Calculators Best Funds Best Places to Retire Fortune Brainstorm Tech Apple 2.0 Blog Big Tech Blog Sectors and Stocks Tech Talk Resource Guide Small Business Makeovers Questions & Answers Small Business Video 100 Best Places to Launch FSB 100 Fortune Small Business Fortune 500 Brainstorm Tech Investing Management C-Suite Rankings Main Create Portfolio Edit Portfolio Create Alerts Edit Alerts

The Economy: Why it feels even worse

In late October, CNN's Ali Velshi and Erica Fink looked at five key measures of the economy to see how bad it really was. Now, they look again at the CNN "Real Feel Economic Index" and find it's tougher still.

1 of 7
BACKNEXT

As you've heard us and others report, the U.S. economy, more so than other worldwide economies, is dependent on spending decisions made by consumers. Consumer behavior drives spending habits, spending habits drive corporate profitability, and corporate profitability drives the stock market.

Success in the stock market is one of those things that make Americans feel better about the economy, along with increases in wages (not happening) and increases in home prices (also not happening).

Typically, we measure economic strength or weakness using the GDP, or Gross Domestic Product, which is historically thought of as the broadest measure of economic activity.

But, while GDP may be a good measure of the whole economy (and it may not be, but that's another story), it doesn't reflect all the things that matter to you.

In the fall, we took a look at five measures of the economy that reflect how things really are out there, to see if your fears and concerns are justified. The measures we chose are those that we "touch" on a daily basis.

We looked at how the economy is affecting you, via jobs, personal income, personal savings, industrial production, and home prices.

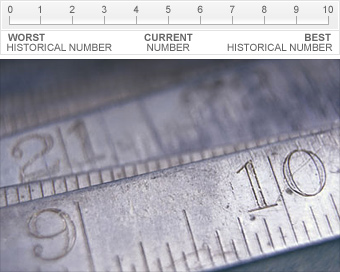
We charted them on a scale of 0-to-10: 0 being the worst that each of them has been since 1980; 10 being the best.

1980 was our starting point because experts agree that the economy before then was so different from what it is now that it would be like comparing apples and oranges.

Now, over a year into the recession, we're taking a look at it again.

We call it the CNN "Real Feel Economic Index."


NEXT: Jobs

Last updated October 23 2009: 4:39 PM ET
Email | Print | Share  |  RSS
 
google my aol my msn my yahoo! netvibes
Paste this link into your favorite RSS desktop reader
See all CNNMoney.com RSS FEEDS (close)
More Galleries
Holiday gifts for the yoga nut These 7 small brands are helping fuel a booming yoga industry. More
Best of the L.A. Auto Show Fuel economy is the name of the game in Southern California. More
Are things really getting better? Last quarter, the economy grew by the largest amount since the summer of 2007, but there are signs that things are still getting worse. More

Special Offer
© 2009 Cable News Network. A Time Warner Company. All Rights Reserved. Terms under which this service is provided to you. Privacy Policy
Copyright © 2009 BigCharts.com Inc. All rights reserved. Please see our Terms of Use.
MarketWatch, the MarketWatch logo, and BigCharts are registered trademarks of MarketWatch, Inc.
Intraday data provided by Interactive Data Real-Time Services and subject to the Terms of Use.
Intraday data is at least 20-minutes delayed. All times are ET.
Historical, current end-of-day data, and splits data provided by Interactive Data Pricing and Reference Data.
Fundamental data provided by Morningstar, Inc..
SEC Filings data provided by Edgar Online Inc..
Earnings data provided by FactSet CallStreet, LLC.