| Key financials |
$ millions |
% change
from 2008 |
| Revenues |
7,094.2 |
-11.1 |
| Profits |
435.8 |
-8.6 |
| Assets |
4,323.9 |
— |
| Stockholders' equity |
1,491.0 |
— |
| Market value (3/26/2010) |
7,323.4 |
— |
| Profits as % of |
|
| Revenues |
6.1 |
| Assets |
10.1 |
| Stockholders' equity |
29.2 |
| Earnings per share |
|
| 2009 $ |
3.78 |
| % change from 2008 |
-5.5 |
| 1999-2009 annual growth rate % |
7.7 |
| Total return to investors |
% |
| 2009 |
5.9 |
| 1999-2009 annual rate |
13.8 |
| 4 | Monsanto | 197 | 11,740.0 | | 5 | Mosaic | 231 | 10,298.0 | | 6 | Praxair | 262 | 8,956.0 | | 7 | Air Products & Chemicals | 273 | 8,381.4 | | 8 | Ashland | 280 | 8,106.0 | | 9 | Huntsman | 293 | 7,763.0 | | 10 | Sherwin-Williams | 319 | 7,094.2 | | 11 | Avery Dennison | 362 | 5,952.7 | | 12 | Ecolab | 365 | 5,900.6 | | 13 | Celanese | 414 | 5,082.0 | | 14 | Eastman Chemical | 415 | 5,047.0 | | 15 | Lubrizol | 453 | 4,586.3 |
|
Interactives
-
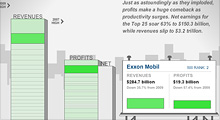
See how revenues and profits at America's 25 largest companies have risen and fallen over the past decade.
-
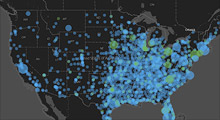
From a single store in 1962 to more than 4,300 outlets today, see how the biggest retailer has expanded.
|


