Click chart for more Treasuries data.
NEW YORK (CNNMoney) -- Treasury prices have been on an upward trend since the beginning of April, as traders duck into the bond market amid worries about a slowing U.S. economy.
Prices continued to rally Thursday after the latest GDP report showed that economic growth remains weak -- leaving yields at their lowest levels in about five months.
The yield on the benchmark 10-year note slumped to 3.09% from 3.13% on Wednesday. That's about 50 basis points lower than April levels, when the 10-year yield traded at 3.60%.
The 3% mark on the 10-year yield is psychologically important for traders. Before April, the yield was stuck right around 3.4% for about five months, and now traders are worried that we're breaking out of that range on the downside
"The question now is if it's going to continue lower or head back higher, since we're right on the edge," said Richard Bryant, head of Treasury trading at MF Global. "Many people psychologically believe that 10-year yields don't belong below the 3% mark."
It's hard to predict the future for Treasuries when recent trading has been so rocky, said Bryant.
"The last couple years have been pretty atypical," said Bryant. "The market is very impatient, and everyone wants to make big sweeping generalizations, so the market is prone to these big swings in sentiment."
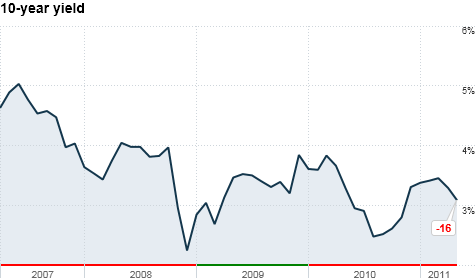
If you go all the way back to the middle of 2007, the 10-year yield was at 5%.
As worries about a weak housing market arose, the yield backed down to 4%, and when the financial crisis struck at the end of 2008, yields were slashed in half -- to 2%.
But three months after the S&P 500 hit its all-time low, the government's intervention helped Treasury yields perk back up to about 4%, and they have largely bounced between 4% and 3.25% since then.
During the Spring of last year, the 10-year yield was close to breaching 4% as traders began regaining confidence in riskier assets, such as equities. But when economic reports didn't improve as much as traders had expected, the 10-year yield slumped to 2.5% in August 2010. And that's when the Federal Reserve stepped in with another round of bond buying, known as QE2.
The introduction of QE2 boosted the 10-year yield back up to 3.5% as traders once again thought the economy was on the mend. And that's where it stayed until April of this year, when reports began to disappoint again.
"[QE2] was a false start -- now economic data is coming in on the weak side, and the jobs market is struggling to bring in the gains in employment that we need to see, and manufacturing data hasn't lived up to expectations," said Bryant. "The market now seems to be toying with revisiting the low yields we saw last year right before QE2."
That means we could be headed for yields as low as 2.5% for the 10-year note.
Next week's plate of economic data will be particularly important for the bond market, given its recent string of declines. Traders will be looking to the government's closely-watched monthly jobs report, due Friday, for any signs of improvement.
"People have already factored in the end of QE2 on June 30, so decisions are going to be based on the strength of the data in the U.S.," said Bryant. "If data continues to disappoint, Treasuries will continue to do better and rates will continue lower." ![]()
| Index | Last | Change | % Change |
|---|---|---|---|
| Dow | 32,627.97 | -234.33 | -0.71% |
| Nasdaq | 13,215.24 | 99.07 | 0.76% |
| S&P 500 | 3,913.10 | -2.36 | -0.06% |
| Treasuries | 1.73 | 0.00 | 0.12% |
| Company | Price | Change | % Change |
|---|---|---|---|
| Ford Motor Co | 8.29 | 0.05 | 0.61% |
| Advanced Micro Devic... | 54.59 | 0.70 | 1.30% |
| Cisco Systems Inc | 47.49 | -2.44 | -4.89% |
| General Electric Co | 13.00 | -0.16 | -1.22% |
| Kraft Heinz Co | 27.84 | -2.20 | -7.32% |
| Overnight Avg Rate | Latest | Change | Last Week |
|---|---|---|---|
| 30 yr fixed | 3.80% | 3.88% | |
| 15 yr fixed | 3.20% | 3.23% | |
| 5/1 ARM | 3.84% | 3.88% | |
| 30 yr refi | 3.82% | 3.93% | |
| 15 yr refi | 3.20% | 3.23% |
Today's featured rates:

