Search News

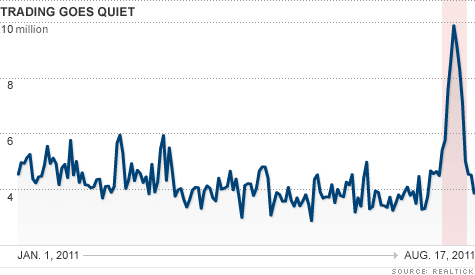
After months of quiet trading, volumes soared last week due in part to the S&P downgrade, the euro crisis and bad economic data. Click the chart for more market data.
NEW YORK (CNNMoney) -- It looks like Wall Street is back to doing what it does best in August - going on vacation.
Trading volumes on the major U.S. exchanges have returned to the sluggish levels you'd normally expect in late summer after the near record daily volumes from only a week ago.
About 3.9 billion shares moved on The New York Stock Exchange Wednesday, less than half the average volume from a week ago. Tuesday's activity was only slightly busier, with volume of 4.5 billion shares.
Trading volumes have been in decline for several years now, which has been one reason why many of the world's exchanges are now merging. The NYSE typically has 4 billion to 5 billion shares exchange hands on a given trading day, which down from average volumes of 5 billion to 6 billion shares a couple years ago.
"The retail crowd was out of the market following the financial crisis and a lot of hedge funds had been wiped out as well," said Ryan Detrick, senior technical strategist with Schaeffer's Investment Research.
But last week market volumes surged to levels not seen in more than a year.
The NYSE posted its fourth-largest trading day on record on Aug. 8 - the day the Dow plunged 635 points -- with 9.9 billion shares trading hands that day. This was followed by volume of 9.2 billion shares on Aug. 9.
Volume typically picks up sharply at times of turmoil in the markets. So it was no surprise that the news of the downgrade of the United States' credit rating, the crisis in Europe and dismal economic data caused investors to trade more frequently.
By the same token, it's not too shocking that volume has fallen again this week, Detrick said. August is typically the slowest month for investors as most of Wall Street is on vacation. But all that can change quickly. Stocks were set to plunge Thursday on more worries about Europe.
"With this headline-driven market, volatility and volumes could pick up sharply once again at any time," Detrick said. ![]()
| Index | Last | Change | % Change |
|---|---|---|---|
| Dow | 32,627.97 | -234.33 | -0.71% |
| Nasdaq | 13,215.24 | 99.07 | 0.76% |
| S&P 500 | 3,913.10 | -2.36 | -0.06% |
| Treasuries | 1.73 | 0.00 | 0.12% |
| Company | Price | Change | % Change |
|---|---|---|---|
| Ford Motor Co | 8.29 | 0.05 | 0.61% |
| Advanced Micro Devic... | 54.59 | 0.70 | 1.30% |
| Cisco Systems Inc | 47.49 | -2.44 | -4.89% |
| General Electric Co | 13.00 | -0.16 | -1.22% |
| Kraft Heinz Co | 27.84 | -2.20 | -7.32% |
| Overnight Avg Rate | Latest | Change | Last Week |
|---|---|---|---|
| 30 yr fixed | 3.80% | 3.88% | |
| 15 yr fixed | 3.20% | 3.23% | |
| 5/1 ARM | 3.84% | 3.88% | |
| 30 yr refi | 3.82% | 3.93% | |
| 15 yr refi | 3.20% | 3.23% |
Today's featured rates: