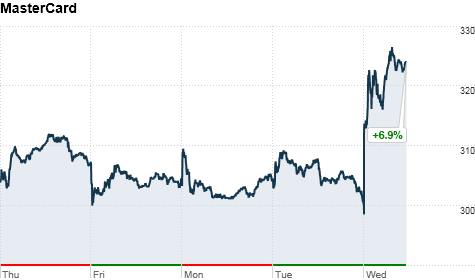
Click the chart for more data on MasterCard.
NEW YORK (CNNMoney) -- While the investment world is still concerned with Italy's and Spain's sovereign debt issues, earnings reports continue to offer a rare glimpse into the state of the different sectors of the economy.
Shares of MasterCard (MA, Fortune 500) reached an all-time high Wednesday after the credit card company reported earnings and sales well above forecasts.
MasterCard continues to benefit from the the shift to electronic payments as the world gradually adopts debit and credit cards for everyday purchases.
The company also hopes to gain domestic market share from its biggest competitor Visa due to a new debit-card rule that requires all card issuers to provide merchants the choice of at least two unaffiliated networks for transaction processing.
Shares of Visa (V, Fortune 500), which is the world largest global payment processing company, gained more than 2%.
These are among the popular themes on StockTwits Wednesday:
Nils1975: $MA worldwide purchase volume accelerated in Q2 up 16.3% vs. 12.9% in Q1.
firstadopter: $MA call: "Spending Pulse data +6% y/y last 4 months including July, but much of it is likely due to inflation."
Benzinga: $MA MasterCard Reports Q2 EPS $4.76 vs $4.22 Est; Revenues $1.67B vs $1.55B Est.
TraderFlorida: $MA Bouncing pre-market on solid earnings - watch for clear break of upper trend line $318.75 on volume.
ldrogen: Have been harping on this for a few months, $MA is the better long against $V, new all time highs, $V lagging technically for a while. ![]()
| Index | Last | Change | % Change |
|---|---|---|---|
| Dow | 32,627.97 | -234.33 | -0.71% |
| Nasdaq | 13,215.24 | 99.07 | 0.76% |
| S&P 500 | 3,913.10 | -2.36 | -0.06% |
| Treasuries | 1.73 | 0.00 | 0.12% |
| Company | Price | Change | % Change |
|---|---|---|---|
| Ford Motor Co | 8.29 | 0.05 | 0.61% |
| Advanced Micro Devic... | 54.59 | 0.70 | 1.30% |
| Cisco Systems Inc | 47.49 | -2.44 | -4.89% |
| General Electric Co | 13.00 | -0.16 | -1.22% |
| Kraft Heinz Co | 27.84 | -2.20 | -7.32% |
| Overnight Avg Rate | Latest | Change | Last Week |
|---|---|---|---|
| 30 yr fixed | 3.80% | 3.88% | |
| 15 yr fixed | 3.20% | 3.23% | |
| 5/1 ARM | 3.84% | 3.88% | |
| 30 yr refi | 3.82% | 3.93% | |
| 15 yr refi | 3.20% | 3.23% |
Today's featured rates:

