Click chart for more on oil and other commodities.
NEW YORK (CNNMoney) -- OPEC cut its forecast Monday for global oil demand and production, citing the slowing economic recovery.
In a monthly report, the Organization of Petroleum Exporting Countries said it expected demand growth to drop to 1.1 million barrels per day -- 150,000 barrels per day fewer than its earlier forecasts.
OPEC also trimmed back its oil production outlook, saying it still expects output to increase, but by a slightly smaller 500,000 barrels per day in 2011 -- 80,000 barrels below its prior forecast.
"The downward adjustment has been due to a weaker-than-expected driving season in the US and the ongoing sluggish economic performance in the OECD," said the report, referring to an organization of 32 member nations that includes the United States., the United Kingdom, Germany and Japan.
OPEC said weaker-than-expected demand from China and "ongoing economic uncertainties" were reflective of a global slowdown in industrial activity in most major economies.
OPEC noted that the forecast for global economic growth had edged down to 3.6% for 2011 from the previous forecast of 3.7%, and down to 3.9% for 2012 from the previously expected 4%.
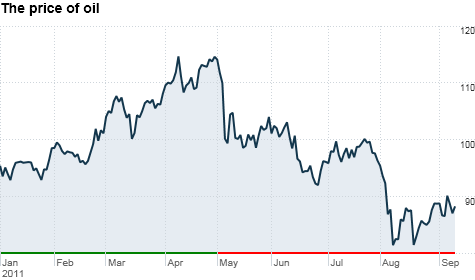
Meanwhile, U.S. crude oil prices have dropped 4.5% year-to-date to about $88 per barrel. Goldman Sachs analysts forecast U.S. crude will average $126.50 a barrel next year.
Prices "remain strong despite the market's concerns that rising sovereign debt issues and a significant slowdown in economic growth could push the U.S. economy back into recession," said Goldman analysts in a weekly energy report.
Goldman Sachs said the "tight" oil supply has been alleviated somewhat by the release of 600,000 barrels per day, over the last seven weeks, by the Strategic Petroleum Reserve. But this won't last forever.
"We therefore expect that the market will tighten further for the remainder of the year and going into next year as this source of supply disappears, effectively drawing down OPEC spare capacity and pushing prices higher," wrote Goldman analysts David Greely and Stefan Wieler.
Goldman also reiterated its forecast for Brent oil prices to average $130 per barrel next year. Brent, the European benchmark, is currently trading at around $113 a barrel.
U.S. gas prices are closely tied to the European benchmark, with many U.S. refineries using imported oil to produce gas, especially on the East Coast.
The nationwide average price for regular unleaded fell six-tenths of a cent to $3.649 per gallon Monday, according to motorist group AAA. The average price is down 46.5 cents, or about 11.3%, from the record high of $4.114 reported on July 17, 2008. ![]()
| Index | Last | Change | % Change |
|---|---|---|---|
| Dow | 32,627.97 | -234.33 | -0.71% |
| Nasdaq | 13,215.24 | 99.07 | 0.76% |
| S&P 500 | 3,913.10 | -2.36 | -0.06% |
| Treasuries | 1.73 | 0.00 | 0.12% |
| Company | Price | Change | % Change |
|---|---|---|---|
| Ford Motor Co | 8.29 | 0.05 | 0.61% |
| Advanced Micro Devic... | 54.59 | 0.70 | 1.30% |
| Cisco Systems Inc | 47.49 | -2.44 | -4.89% |
| General Electric Co | 13.00 | -0.16 | -1.22% |
| Kraft Heinz Co | 27.84 | -2.20 | -7.32% |
| Overnight Avg Rate | Latest | Change | Last Week |
|---|---|---|---|
| 30 yr fixed | 3.80% | 3.88% | |
| 15 yr fixed | 3.20% | 3.23% | |
| 5/1 ARM | 3.84% | 3.88% | |
| 30 yr refi | 3.82% | 3.93% | |
| 15 yr refi | 3.20% | 3.23% |
Today's featured rates:


