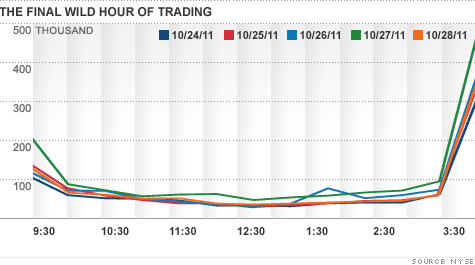
Rebalancing of leveraged ETFs could be a major force behind increased volume and volatility in the last hour of trading.
NEW YORK (CNNMoney) -- If the daily 200-point drops or spikes in the Dow aren't enough to cause heart palpations among investors, the seemingly inexplicable gyrations in the final hour of trading probably do.
"There have been more pronounced moves in that last hour that are more violent than in the other five and a half hours of the day," said Peter Boockvar, equity strategist at Miller Tabak + Co.
At the New York Stock Exchange, trading volumes between 3 p.m. ET and 4 p.m. ET are roughly four to five times heavier than any other time of day.
One big reason: the explosion of leveraged exchange-traded funds.
"Leveraged ETFs are growing, so a bunch of people are rushing to the market at the end of day," said Pauline Shun, associate professor of finance at York University in Canada who has written studies on leveraged ETFs. "It has to affect volatility at the end of the day."
Due to their structure, leveraged ETFs conduct most of their trading during that last hour because they need to rebalance by day's end, whereas traditional ETFs buy and sell stocks throughout the day and don't do a daily rebalance.
Leveraged ETFs are riskier than traditional ETFs, using derivatives or swap contracts, and taking advantage of put (the right to sell) and call (the right to buy) options, rather than trading underlying stocks.
Leveraged ETFs simply aim to give investors magnified returns (or losses) on market direction bets over one trading day.
These ETFs are not geared toward the average investor who wants to buy and hold assets for the long term.
For example, the Nasdaq 100 has gained 6.1% in 2011 but ProShares' Ultra QQQ (QLD), which tries to double the Nasdaq's performance, has only jumped 7.65%.
Leveraged ETFs also give investors an easy way to take short positions or big bets on a sharp drop in different markets, including the Dow Jones Industrial Average (DJI), Nasdaq Composite (NDX), S&P 500 (GSPC), the more thinly traded small-cap Russell 2000 (RUT), commodities or even foreign exchange markets.
Congress has also taken notice of both the market volatility and leveraged ETFs. In mid-October, the Senate held a hearing to determine whether these ETFS were causing the wild market swings.
Investors have had a seemingly insatiable appetite for exchange-traded funds. In the United States, there's about $970 billion sitting in ETFs. That's a 1,182% increase since 2000. Most have low minimum investment levels, charge fees well below those of mutual funds and let investors buy and sell throughout the trading day.
Because they try to double or triple returns, it's been estimated that the leveraged funds account for 26% of total ETF volume.
The sheer size of the overall ETF market has caused massive dislocations and distortions in the equity markets, said Harold Bradley, the chief investment officer at the Kauffman Foundation, co-authored a study on ETFs' potential effects on the markets.
"Like a sneeze in a crowd at the mall, that sneeze has the effect of making everybody sick. The volatility is the expression of a market that's far outgrown its underlying constituents," said Bradley. ![]()
| Index | Last | Change | % Change |
|---|---|---|---|
| Dow | 32,627.97 | -234.33 | -0.71% |
| Nasdaq | 13,215.24 | 99.07 | 0.76% |
| S&P 500 | 3,913.10 | -2.36 | -0.06% |
| Treasuries | 1.73 | 0.00 | 0.12% |
| Company | Price | Change | % Change |
|---|---|---|---|
| Ford Motor Co | 8.29 | 0.05 | 0.61% |
| Advanced Micro Devic... | 54.59 | 0.70 | 1.30% |
| Cisco Systems Inc | 47.49 | -2.44 | -4.89% |
| General Electric Co | 13.00 | -0.16 | -1.22% |
| Kraft Heinz Co | 27.84 | -2.20 | -7.32% |
| Overnight Avg Rate | Latest | Change | Last Week |
|---|---|---|---|
| 30 yr fixed | 3.80% | 3.88% | |
| 15 yr fixed | 3.20% | 3.23% | |
| 5/1 ARM | 3.84% | 3.88% | |
| 30 yr refi | 3.82% | 3.93% | |
| 15 yr refi | 3.20% | 3.23% |
Today's featured rates: