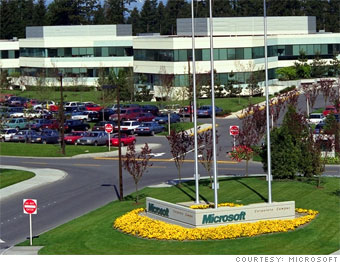
Market cap (billions): $262.3
PEG ratio: 1.2
Earnings growth*: 12%
Debt/equity ratio: 0
The software giant most famous for its Windows operating system is looking to reach past its traditional desktop markets for long-term growth. Microsoft has expanded into the Web-based software market, and its Xbox 360 game console has been a big hit.
Of course, the company continues to play catch-up to Google in online advertising. Microsoft is still considering a partnership with Yahoo, despite its failed takeover attempt. But Microsoft remains a strong company trading at an attractive price. Its earnings are expected to increase by approximately 12% annually over the next few years, and it trades for just 14 times earnings, giving it a PEG of 1.2.
NEXT: BARGAIN GROWTH: Parker Hannifin
-

Abbott Labs -

Coca-Cola -

Colgate-P... -

General M... -

Illinois ... -

Johnson &... -

Procter &... -

US Bancorp -

Accenture -

Chubb -

Cisco Sys... -

McKesson -

3M -

Microsoft -

Parker Ha... -

Walgreen -

Applied I... -

Carlisle ... -

Cascade -

National ... -

Pfizer -

Regal Bel... -

UST -

VF Corp. -

Adtran -

AVX -

Fair Isaac -

Global In... -

Grey Wolf -

Penn Virg... -

Plexus -

Tessera T... -

BP -

Diageo -

Novartis -

Philips E... -

Sanofi-Av... -

Total -

Unilever -

Vodafone ...
Last updated June 20 2008: 2:35 PM ET
Criteria include PEG ratios (price/earnings ratio divided by earnings growth rate) below S&P 500's PEG ratio of 2.2, long-term earnings growth equal to or greater than the S&P 500's estimated 7% rate, and debt-equity ratio below 0.33.
*Wall Street estimates for the next three to five years.
Source: Zacks Investment Research
*Wall Street estimates for the next three to five years.
Source: Zacks Investment Research
