GROWTH AND INCOME: Procter & Gamble
Market cap billions: $198.0
P/E ratio*: 20
Earnings growth**: 12%
Dividend yield: 2.4%
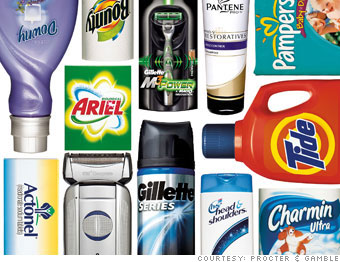
Procter & Gamble, the consumer products giant, makes everything from paper towels to razors. The company has upped its dividend by 12% over the past decade, consistently met its growth projections and unleashed a slew of new products since Chief Executive A.G. Lafley took over in 2000.
Lafley's policy of organic growth, rather than growth through acquisition, carries much less risk. And emphasis on core brands, such as Crest toothpaste and Tide laundry detergent, appears to be paying off. "Virtually everything we sell is not discretionary. It's a staple. You have to go to the bathroom. You have to get up in the morning and brush your teeth. You've got to shower. You've got to shave," said Lafley during a conference call with analysts in April.
NEXT: GROWTH AND INCOME: US Bancorp
-

Abbott Labs -

Coca-Cola -

Colgate-P... -

General M... -

Illinois ... -

Johnson &... -

Procter &... -

US Bancorp -

Accenture -

Chubb -

Cisco Sys... -

McKesson -

3M -

Microsoft -

Parker Ha... -

Walgreen -

Applied I... -

Carlisle ... -

Cascade -

National ... -

Pfizer -

Regal Bel... -

UST -

VF Corp. -

Adtran -

AVX -

Fair Isaac -

Global In... -

Grey Wolf -

Penn Virg... -

Plexus -

Tessera T... -

BP -

Diageo -

Novartis -

Philips E... -

Sanofi-Av... -

Total -

Unilever -

Vodafone ...
Last updated June 20 2008: 2:35 PM ET
Criteria include long-term earnings growth equal to or greater than the S&P 500's estimated 7% rate, dividend yield greater than the S&P 500's 2%, and P/E ratios below 27.
*Based on previous 12-months' reported earnings.
**Wall Street estimates for the next three to five years.
Source: Zacks Investment Research
*Based on previous 12-months' reported earnings.
**Wall Street estimates for the next three to five years.
Source: Zacks Investment Research